The national poverty rate was 12.8% in 2021, but was significantly different for the nation’s oldest and youngest populations, according to a new Census Bureau report released today.
The child poverty rate (for people under age 18) was 16.9% in 2021, 4.2 percentage points higher than the national rate, while poverty for those ages 65 and over was 10.3%, 2.5 percentage points lower than the national rate.
The American Community Survey (ACS) 1-year estimates provide data for a number of demographic, social and economic indicators, including poverty. The estimates are used by planners, policymakers and community stakeholders to evaluate trends and make comparisons across demographic groups.
Government agencies, researchers and local organizations regularly use these estimates to measure economic well-being and identify the number of individuals and families eligible for various programs.
How poverty is measured
Poverty status is determined by comparing annual income to a set of dollar values (called poverty thresholds) that vary by family size, number of children and the age of the householder.
If a family’s pre-tax income is less than the dollar value of their threshold, that family and every member are considered to be in poverty. For people not living in families, poverty status is determined by comparing the individual’s income to their poverty threshold.
The poverty measure excludes children under the age of 15 who are not related to the householder, people living in institutional group quarters – such as correctional facilities and nursing homes – as well as people living in college dormitories or military barracks.
Child poverty by state, region and metro
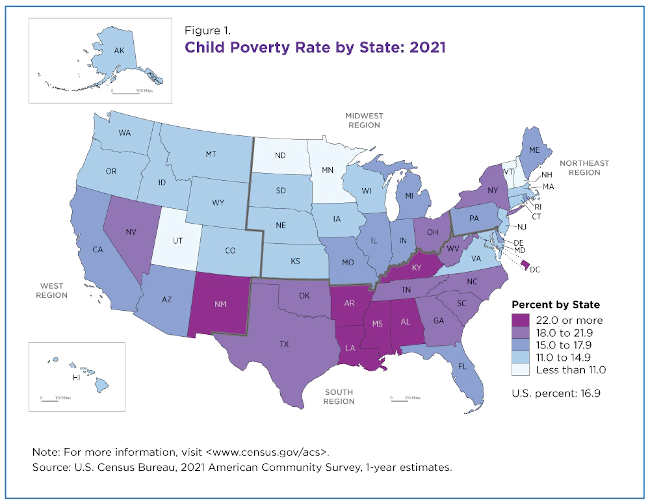
The national child poverty rate was 16.9% but there was considerable variation among states, ranging from 8.1% to 27.7%.
Figure 1 illustrates the uneven geographic distribution of child poverty in every state and the District of Columbia.
Three-quarters of states in the South region (12 states) and the District of Columbia had child poverty rates of at least 18.0%.
The Midwest and Northeast each had only one state with child poverty rates of at least 18.0% and the West had two.
Child poverty rates by state:
• Among the lowest were Utah (8.1%) and New Hampshire (9.2%). (These estimates are not significantly different from one another.) • Among the highest were Mississippi (27.7%), Louisiana (26.9%) and the District of Columbia (23.9%). (These estimates are not significantly different from one another.)
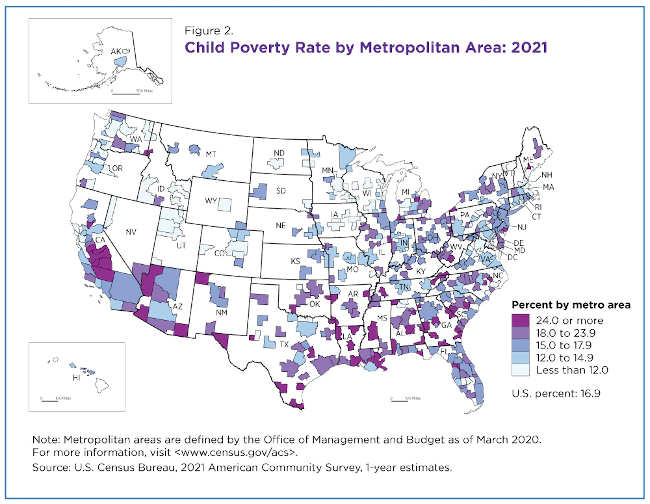
Child poverty rates also varied widely – from 2.1% to 39.2% – among the nation’s 384 Metropolitan Statistical Areas or metro areas in 2021 (Figure 2).
Forty-one (69.5%) of the 59 metro areas with the nation’s highest child poverty rates were in the South and accounted for 26.3% of all of the region’s 156 metro areas.
In contrast, only 5.1% of metro areas in the highest child poverty rate category were in the Northeast and the Midwest, and 20.3% in the West. More than a third (31 of 86) of the metro areas in the lowest child poverty category were in the West; these metro areas accounted for over 35% of the region’s total metro areas.
Poverty rate for people ages 65 and over
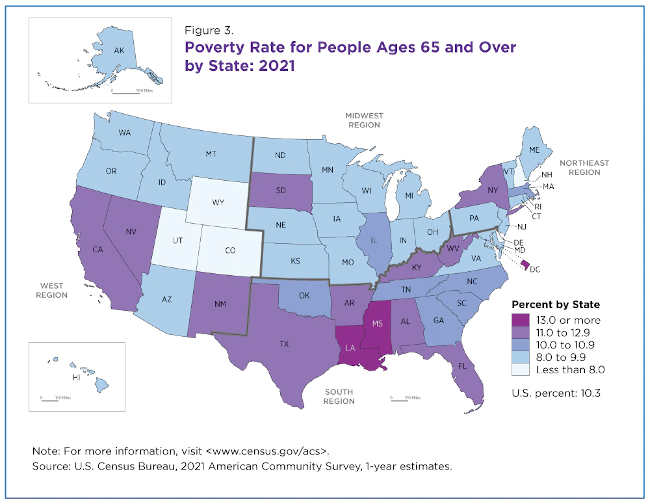
In 2021, the national poverty rate for people ages 65 and over was 10.3%, significantly lower than the poverty rate for all people and the child poverty rate.
There were geographic variations in these poverty rates though not as pronounced as for the child poverty rate. The poverty rates for the older population ranged from 6.7% to 14.1% (Figure 3).
The South had eight states and the District of Columbia with poverty rates of 11.0% or more. No other region had more than three states with such high poverty rates for the 65-plus population.
Ages 65 and over poverty rates by state:
Among the lowest: Wyoming (6.7%), New Hampshire (6.9%), Delaware (6.9%), Utah (7.7%), and Colorado (7.7%). (These estimates are not significantly different from one another.) Among the highest: Louisiana (14.1%), the District of Columbia (13.8%), Mississippi (13.8%) and New Mexico (12.8%). (These estimates are not significantly different from one another.)
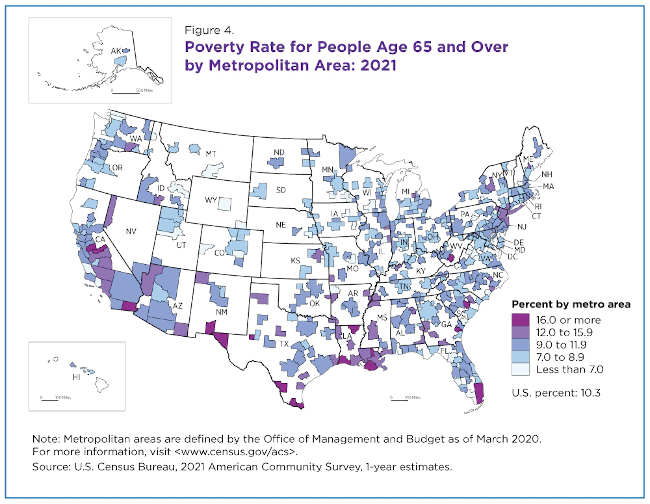
There were even greater variations in the poverty of the older populations between metro areas – from 3.1% to 31.6% (Figure 4).
The majority (276 or 71.9%) of the nation’s 384 metro areas had poverty rates for people ages 65 and over that fell into two categories on the map: 7.0%-8.9% and 9.0%-11.9%.
Of the 61 metro areas with poverty rates at 12.0% or higher for people ages 65 and over, 53 were in the South (39) or the West (14). The South had 25% of all its metro areas in the two highest poverty categories compared to just 5.4% of those in the Midwest.
Additional poverty data from the 2021 release and links to poverty estimates from other surveys such as the Current Population Survey Annual Social and Economic Supplement (CPS ASEC) and the Survey of Income and Program Participation (SIPP) are available on this topics page.
Craig Benson is a survey statistician in the Census Bureau’s Poverty Statistics Branch.
State Controller Betty T. Yee has published the 2021 self-reported payroll data for University of California institutions and California Community College districts on the Government Compensation in California website.
The data cover more than 404,000 positions and approximately $23.94 billion in total wages.
Users of the site can view compensation levels on maps and search by region; narrow results by name of the entity or by job title; and export raw data or custom reports.
All 11 UC institutions — including 10 campuses and the Office of the President — voluntarily filed compliant reports with the State Controller’s Office (SCO). UC data cover 299,448 employees and more than $19.19 billion in total wages.
Forty-four CCC districts voluntarily filed compliant reports with SCO. CCC data published cover 104,856 employees and more than $4.74 billion in total wages.
Fourteen CCC districts did not file a report with SCO, while another 14 filed reports that were not compliant.
Among those districts which did not file are the two districts serving Lake County: the Mendocino-Lake Community College District and the Yuba Community College District.
California law requires cities, counties, and special districts to annually report compensation data to the State Controller.
The state controller also maintains and publishes state and CSU salary data. No such statutory requirement exists for UC, CCCs, superior courts, fairs and expositions, First 5 commissions, or K-12 education providers; their reporting is voluntary.
Since the website launched in 2010, it has registered more than 14 million pageviews. The site contains pay and benefit information on more than two million government jobs in California, as reported annually by each entity.
As the chief fiscal officer of California, Controller Yee is responsible for accountability and disbursement of the state’s financial resources. The controller has independent auditing authority over government agencies that spend state funds. She is a member of numerous financing authorities, and fiscal and financial oversight entities including the Franchise Tax Board. She also serves on the boards for the nation’s two largest public pension funds.
LAKE COUNTY, Calif. — Lake County Animal Care and Control has several more kittens now ready to be adopted.
Call Lake County Animal Care and Control at 707-263-0278 or visit the shelter online at http://www.co.lake.ca.us/Government/Directory/Animal_Care_And_Control.htm for information on visiting or adopting.
The following cats at the shelter have been cleared for adoption.
“Mom” is a 2-year-old female domestic shorthair cat in kennel No. 3, ID No. LCAC-A-4080. Photo courtesy of Lake County Animal Care and Control. ‘Mom’
“Mom” is a 2-year-old female domestic shorthair cat with an orange and white coat.
She is in kennel No. 3, ID No. LCAC-A-4080.
“Mama” is a 2-year-old domestic shorthair cat in cat room kennel No. 7, ID No. LCAC-A-3884. Photo courtesy of Lake County Animal Care and Control. ‘Mama’
“Mama” is a 2-year-old domestic shorthair cat with an all-black coat.
She is in cat room kennel No. 7, ID No. LCAC-A-3884.
This 2-year-old female domestic shorthair cat is in cat room kennel No. 10, ID No. LCAC-A-3661. Photo courtesy of Lake County Animal Care and Control. Female domestic shorthair
This 2-year-old female domestic shorthair cat has a gray tabby coat.
“She is an adult cat with some playful kitten tendencies when toys are brought out. She has a sweet little meow and likes to have playful chats with you,” shelter staff said.
She is in cat room kennel No. 10, ID No. LCAC-A-3661.
This 3-year-old male domestic shorthair cat is in cat room kennel No. 13, ID No. LCAC-A-4021. Photo courtesy of Lake County Animal Care and Control. Male domestic shorthair
This 3-year-old male domestic shorthair cat has an orange tabby coat.
“This guy can be shy at first, but once he knows that you are all about the pets, he will roll right over and start his purr machine. He has a unique curly tail which he flicks around when curious,” shelter staff said.
He is in cat room kennel No. 13, ID No. LCAC-A-4021.
This 2-month-old male domestic shorthair kitten is in cat room kennel No. 36A, ID No. LCAC-A-4081. Photo courtesy of Lake County Animal Care and Control. Male domestic shorthair kitten
This 2-month-old male domestic shorthair kitten has a white coat and blue eyes.
He is in cat room kennel No. 36A, ID No. LCAC-A-4081.
This 2-month-old male domestic shorthair kitten is in cat room kennel No. 36B, ID No. LCAC-A-4082. Photo courtesy of Lake County Animal Care and Control. Male domestic shorthair kitten
This 2-month-old male domestic shorthair kitten has a light orange coat.
He is in cat room kennel No. 36B, ID No. LCAC-A-4082.
This 2-month-old male domestic shorthair kitten is in cat room kennel No. 36C, ID No. LCAC-A-4083. Photo courtesy of Lake County Animal Care and Control. Male domestic shorthair kitten
This 2-month-old male domestic shorthair kitten has an orange coat.
He is in cat room kennel No. 36C, ID No. LCAC-A-4083.
This 1-year-old male domestic longhair cat is in kennel No. 107, ID No. LCAC-A-4023. Photo courtesy of Lake County Animal Care and Control. Male domestic longhair cat
This 1-year-old male domestic longhair cat has a black and white coat.
“This guy had a hard start, but has a lot of love to give once he warms up to you,” shelter staff said.
Staff said he also loves brushing and shows his appreciation with purring and head bumps.
He is in kennel No. 107, ID No. LCAC-A-4023.
This 2-month-old female domestic shorthair kitten is in kennel No. 129a, ID No. LCAC-A-4084. Photo courtesy of Lake County Animal Care and Control.Female domestic shorthair kitten
This 2-month-old female domestic shorthair kitten has a white coat with orange markings.
She is in kennel No. 129a, ID No. LCAC-A-4084.
This 2-month-old female domestic shorthair kitten is in kennel No. 129b, ID No. LCAC-A-4085. Photo courtesy of Lake County Animal Care and Control. Female domestic shorthair kitten
This 2-month-old female domestic shorthair kitten has a gray coat with white markings.
She is in kennel No. 129b, ID No. LCAC-A-4085.
This 2-month-old female domestic shorthair kitten is in kennel No. 129c, ID No. LCAC-A-4086. Photo courtesy of Lake County Animal Care and Control. Female domestic shorthair kitten
This 2-month-old female domestic shorthair kitten has a tortoiseshell coat.
She is in kennel No. 129c, ID No. LCAC-A-4086.
Email Elizabeth Larson at This email address is being protected from spambots. You need JavaScript enabled to view it.. Follow her on Twitter, @ERLarson, or Lake County News, @LakeCoNews.
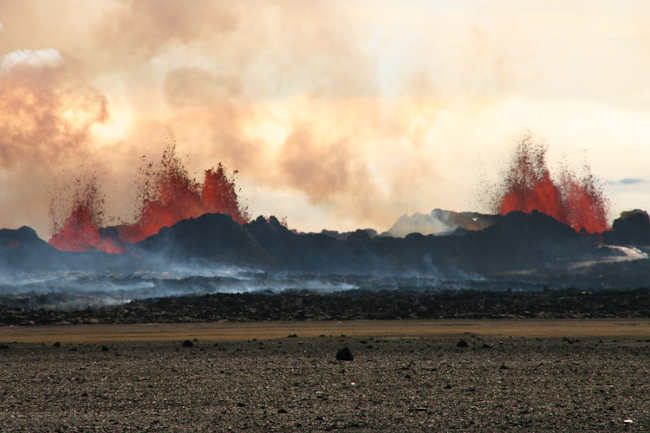
Lava fountaining above the volcanic fissure of the Holuhraun flood lava eruption in Iceland in September 2014, a small-scale analog to the eruptions in the Deccan Traps 66 million years ago and other continental flood basalts. Photo credit: Michelle Parks, University of Iceland. BERKELEY — Mass extinctions litter the history of life on Earth, with about a dozen known in addition to the five largest ones — the last of which, at the end of the Cretaceous Period 66 million years ago, killed off the dinosaurs and 70% of all life on Earth.
A new study, led by scientists at Dartmouth College in New Hampshire, concludes that most of these mass extinctions had one thing in common: They occurred after mega-eruptions that spewed volcanic lava and toxic gases for hundreds of thousands of years, and some for as long as a million years.
The analysis linking mass extinctions throughout Earth’s history with major eruptions, characterized by lava and gas spilling from perhaps dozens of volcanoes and long fissure vents, confirms what many geologists have suspected for years.
The most well-known mass extinction, referred to as the Cretaceous-Paleogene (K-Pg) extinction, was famously tied to a comet or asteroid impact in the Caribbean, but geologists have since found that the impact was preceded by a long period of eruptions in India that left behind flood basalts known today as the Deccan Traps.
Massive amounts of sulfur dioxide emitted during the long-term eruption would have cooled the planet and caused the massive die-off seen in the fossil record.
“It's been obvious to me for some time that there is this correlation between mass extinctions and flood basalt episodes,” said study co-author Paul Renne, professor-in-residence of earth and planetary science at the University of California, Berkeley, and director of the Berkeley Geochronology Center. “But nobody has approached it in the way that’s done in this work, which is to look at the actual rates at which the eruptions happened, which is presumably related to the rate at which climate modifying gases are injected into the atmosphere. And from the analysis, it looks like the rates really matter, especially for the really big ones.”
In fact, he said, there seems to be a threshold “beyond which you're going to get a mass extinction and below which you might get some minor climate perturbations, but not something that extinguishes half of all life on the planet.”
One implication of the study is that the K-Pg extinction was predestined by the Deccan Traps eruptions. The bolide impact was simply the coup de grâce.
“Our results indicate that in all likelihood there would have been a mass extinction at the Cretaceous-Paleogene boundary of some significant magnitude, regardless of whether there was an impact or not, which can be shown more quantitatively now,” Renne said. “The fact that there was an impact undoubtedly made things worse.”
The impact of repeated eruptions over millennia
The new study, publishedin the journal Proceedings of the National Academy of Sciences, shows that four of the five biggest mass extinctions over the past 540 million years — the so-called Phanerozoic Eon — and a handful of other smaller, but still planet-wide, mass extinctions correlate with major lava events that produced large igneous provinces. Known meteor impacts do not correlate with the timeline of mass extinctions.
In the study, a “large” igneous province is one containing at least 100,000 cubic kilometers of magma. For context, the 1980 eruption of Mount St. Helens in Washington involved less than 1 cubic kilometer of magma.
The researchers said that most of the volcanoes represented in the study erupted about a million times more lava than Mount St. Helens did.
The Deccan Traps, for example — traps is an Indian word for steps, because of the step-like structure of overlapping lava flows — erupted over a period of 1 million years and spewed lava flows for distances of at least 500 kilometers, in some places nearly 2 kilometers thick.
“The large, step-like areas of igneous rock from these big volcanic eruptions seem to line up in time with mass extinctions and other significant climactic and environmental events,” said the study’s lead author, Theodore Green, an undergraduate at Dartmouth College who conducted the research as part of the Senior Fellowship program. He now is a graduate student at Princeton University.
The researchers compared the best available estimates of flood basalt eruptions with periods of drastic species die-offs in the geological record. To prove that the correlation was more than chance, they examined whether the eruptions would line up just as well with a randomly generated pattern and repeated the exercise with 100 million such patterns. They determined that the chance that the correlation between eruptions and extinctions was merely random was one in 100.
“While it is difficult to determine if a particular volcanic outburst caused one particular mass extinction, our results make it hard to ignore the role of volcanism in extinction,” said Brenhin Keller, an assistant professor of earth sciences at Dartmouth and senior author of the paper. Keller was a postdoctoral fellow with Renne between 2016 and 2019.
Flood basalt eruptions aren't common in the geologic record, said Green. The last one of comparable, but significantly smaller, scale happened about 16 million years ago in the Pacific Northwest, producing what’s known as the Columbia River Basalt Province. According to Renne, the eruptions are accompanied by massive releases of carbon dioxide, which warms the atmosphere, as well as sulfur dioxide, which cools the atmosphere. Recent evidence indicates that the cooling that leads to a mass extinction is often preceded by warming because the CO2 is emitted first because of its lower solubility in magma than in sulfur.
Renne noted that improved dates for flood basalt events were key to providing better estimates of the rate of eruptions, which enabled the study.
“The punch line is that our ability to draw these kinds of quantitative conclusions have been limited by the availability of high precision geochronology data,” Renne said. “So, this is a poster child for the importance of geochronology.”
Note: Some of this text comes from a press release distributed by Dartmouth’s Office of Communications.
Robert Sanders writes for the UC Berkeley News Center.
LAKE COUNTY, Calif. — The community is invited to join Mother-Wise and Hospice Services of Lake County in an evening of remembrance as they participate in the global Wave of Light on Saturday, Oct. 15.
The evening is set aside to remember all babies lost to miscarriage, stillbirth and neonatal death.
Pregnancy and childbirth are usually joyous, happy and busy times. But when things don’t go as hoped or planned, when the unthinkable happens, families are left with the unimaginable devastation and profound grief that surrounds the loss of a baby.
In 1988 when President Ronald Reagan designated October as national Pregnancy and Infant Loss Awareness Month, he noted that, “When a child loses his parent, they are called an orphan. When a spouse loses her or his partner, they are called a widow or widower. When parents lose their child, there isn’t a word to describe them.”
This is still true, despite the fact that October was set aside to “recognize the loss so many parents experience across the U.S. and around the world.”
Oct. 15 was chosen as a day of remembrance throughout the world.
Since 2003, the global Wave of Light has served as an opportunity for bereaved parents, family and friends to commemorate their babies by lighting a candle at 7 p.m. in their local time zone and leaving it burning for at least one hour.
The result is a continuous “wave of light” spanning the globe for a 24-hour period in remembrance of all loved and longed for babies gone too soon.
Mother-Wise supports Lake County’s expecting and new moms through all transitions that accompany motherhood, including loss, with weekly topic-oriented groups, individualized supportive services, and community resources.
The organization has participated in this special day of remembrance to coincide with similar events worldwide since 2014.
Whether you have endured a loss yourself, or love someone who has, whether this loss was recent or long ago, all are welcome to join in the event.
Participants will meet at Library Park, located at 200 Park St. in Lakeport, and the event will take place from 6 to 8 p.m.
Light refreshments will be offered, as well as community speakers, and remembrance activities. Candles will be provided and lit at 7 p.m.
For any questions, or to RSVP, please contact Mother-Wise at 707-349-1210.
The California Highway Patrol will implement a yearlong federal grant to help save lives and reduce the risk associated with riding a motorcycle.
The goal of the Get Educated and Ride Safe, or GEARS, V grant is to decrease the number of motorcycle-involved crashes and victims through education and enforcement efforts across California through Sept. 30, 2023.
From Oct. 1, 2020, to Sept. 30, 2021, there were 7,078 motorcycle-involved crashes resulting in 354 deaths and 6,400 injuries within CHP jurisdiction, an increase of 3% over the previous 12 months.
“Motorcycle riders are statistically more likely to be injured or killed when involved in a crash,” said CHP Commissioner Amanda Ray. “In an effort to ensure every motorist reaches their destination safely, the CHP will continue to use enforcement and nonenforcement strategies, including education and community engagement, to target the leading causes of traffic deaths.”
During the grant period, the CHP will participate in traffic safety education efforts, such as “May is Motorcycle Safety Awareness Month.”
These campaigns will promote the use of U.S. Department of Transportation-compliant helmets for all riders and raise driver awareness of sharing the road with motorcyclists.
The CHP will also increase enforcement in areas with a high number of motorcycle-involved crashes, which resulted from speed, improper turns, and driving under the influence of alcohol and/or drugs.
Funding for this program was provided by a grant from the California Office of Traffic Safety, through the National Highway Traffic Safety Administration.
The mission of the CHP is to provide the highest level of safety, service and security.
 How to resolve AdBlock issue?