 How to resolve AdBlock issue?
News
With reservoirs nearing capacity and snowmelt runoff starting to occur, DWR now expects to deliver 100% of requested water supplies, up from 75% announced in March.
This water will be delivered throughout the year to the State Water Project’s 29 public water agencies that serve 27 million Californians and 750,000 acres of farmland.
The last time the project, or SWP, allocated 100% was in 2006.
San Luis Reservoir in Merced County, which holds water supply for both the SWP and U.S. Bureau of Reclamation’s Central Valley Project, or CVP, is now full.
Additionally, Lake Oroville, the SWP’s largest reservoir, and SWP reservoirs in Southern California are expected to be full by the end of May.
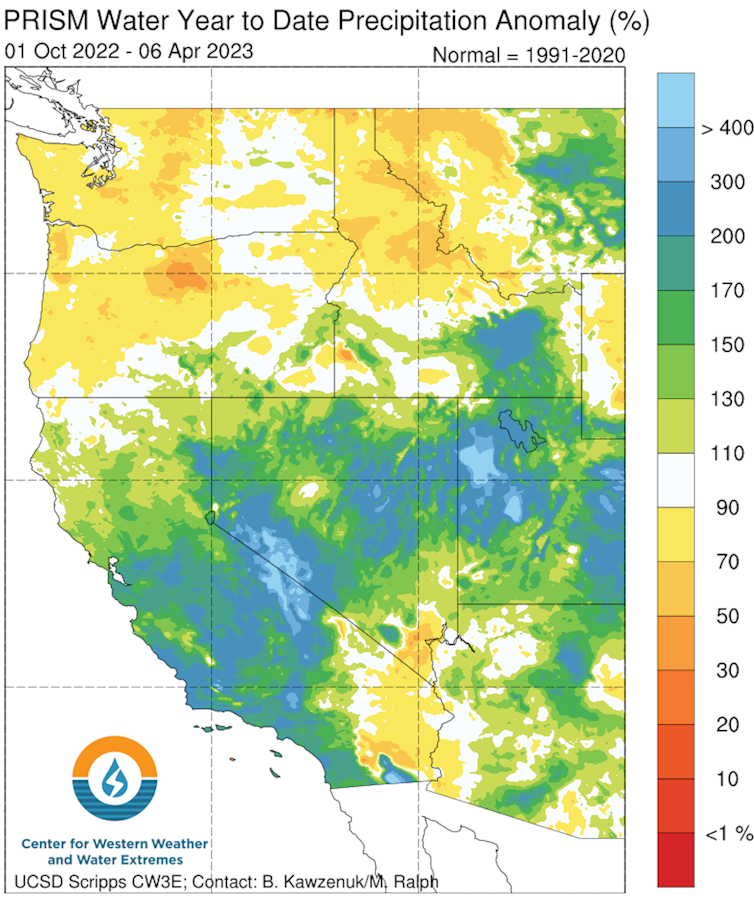
Statewide, reservoir storage is at 105% of average for this date.
“Water supply conditions and careful management of reservoir operations during this extreme winter allows DWR to maximize water deliveries while enhancing protections for the environment,” said DWR Director Karla Nemeth. “DWR is moving and storing as much water as possible to the benefit of communities, agriculture, and the environment.”
This wet winter and strong runoff conditions has allowed the SWP to make additional water available to any contractor that has the ability to store the water in its own system, including through groundwater recharge.
“We are thankful to DWR for maintaining California’s water infrastructure to accommodate all of the water that we have seen through the heavy storm events earlier in the year, allowing for this much-needed increase in water supplies,” said Jennifer Pierre, general manager of the State Water Contractors.
“California’s climate whiplash shows how critical it is to build and maintain the water infrastructure that makes the system work. Whether we are talking about storing water above ground in reservoirs, below ground in aquifers, or the way we move and pump water through 700 miles of canals, pipelines and hydro-electric facilities to get that water to your tap – it is the infrastructure that allows DWR to divert and release water for the benefit of both people and the environment,” Pierre said.
She added, “With California’s changing climate, storage projects such as Sites Reservoir and groundwater recharge, combined with the Delta Conveyance Project and improved San Joaquin Valley conveyance by repairing subsidence damage, are necessary for us to reliably manage our water moving forward. With all the water in the system right now, it can be easy to forget that it’s not a matter of if another drought will come, but when. Investing in the water infrastructure California will always need remains crucial to building California’s resilience to the impacts of our changing climate and hydrology.”
DWR is maximizing the capture and storage of this abundance of snowpack across the state.
Formally known as Article 21 water, this additional water does not count toward SWP allocation amounts. Since March 22, the SWP has delivered 228,000 acre-feet of Article 21 water to local water agencies with 37,000 acre-feet planned for next week.
The SWP typically evaluates the allocation forecasts monthly using the latest snow survey data, reservoir storage and spring runoff forecasts.
The 100% forecasted allocation announced today takes into account that data from April. Runoff analysis will continue, and an additional snow survey will be conducted in May.
While California’s surface water conditions have greatly improved this year following three years of historic drought, several water supply challenges remain in the northern part of the state and in overdrafted groundwater basins that are slow to recover.
Millions of Californians rely on groundwater supplies as a sole source of water.
The Colorado River Basin, which is a critical water supply source for Southern California, is still in the midst of a 23-year drought. Californians should continue to use water wisely to help the state adapt to a hotter, drier future.
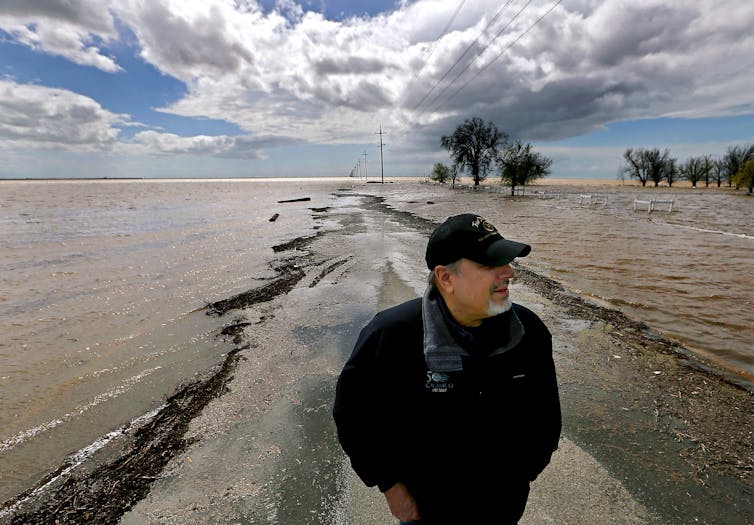
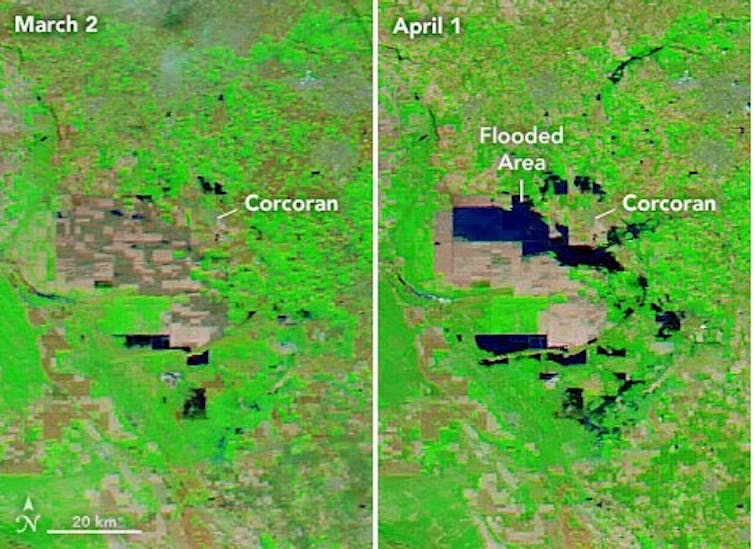
To get a sense of the enormous amount of water atmospheric rivers dumped on the Western U.S. this year and the magnitude of the flood risk ahead, take a look at California’s Central Valley, where about a quarter of the nation’s food is grown.
This region was once home to the largest freshwater lake west of the Rockies. But the rivers that fed Tulare Lake were dammed and diverted long ago, leaving it nearly dry by 1920. Farmers have been growing food on the fertile lake bed for decades.
This year, however, Tulare Lake is remerging. Runoff and snowmelt from the Sierra Nevada have overwhelmed waterways and flooded farms and orchards. After similar storms in 1983, the lake covered more than 100 square miles, and scientists say this year’s precipitation is looking a lot like 1983. Communities there and across the West are preparing for flooding and mudslide disasters as record snow begins to melt.
We asked Chad Hecht, a meteorologist with the Center for Western Weather and Water Extremes at the University of California San Diego’s Scripps Institution of Oceanography, how 2023’s storms compare to past extremes and what to expect in the future.
How extreme were this year’s atmospheric rivers?
California averages about 44 atmospheric rivers a year, but typically, only about six of them are strong storms that contribute most of the annual precipitation total and cause the kind of flooding we’ve seen this year.
This year, in a three-week window from about Dec. 27, 2022, to Jan. 17, 2023, we saw nine atmospheric rivers make landfall, five of them categorized as strong or greater magnitude. That’s how active it’s been, and that was only the beginning.
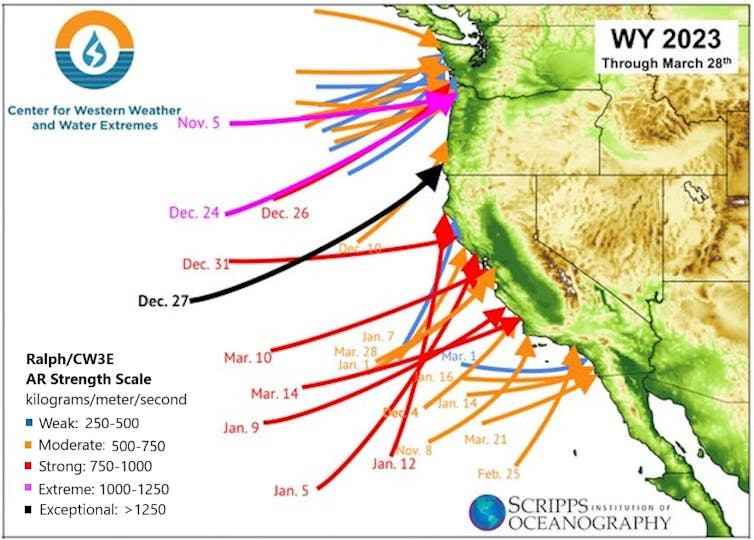
In all, the state experienced 31 atmospheric rivers through the end of March: one extreme, six strong, 13 moderate and 11 weak. And other storms in between gave the Southern Sierra one of its wettest Marches on record.
These storms don’t just affect California. Their precipitation has pushed the snow-water equivalent levels well above average across much of the West, including in Oregon, Nevada, Utah, Idaho and the mountains of western Colorado, Arizona and New Mexico.
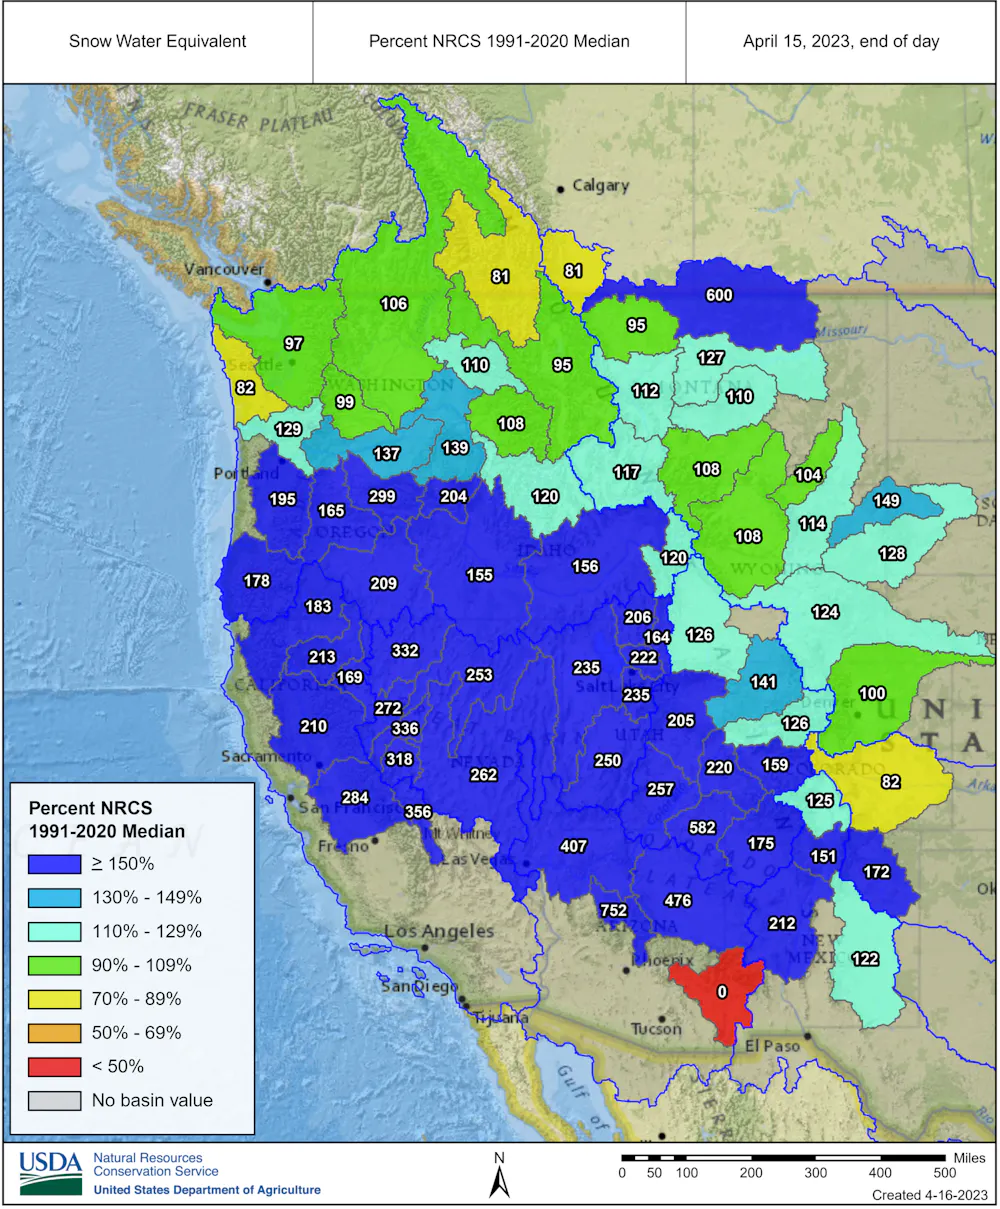
In terms of records, the big numbers this year were in California’s Southern Sierra Nevada. The region has had 11 moderate atmospheric rivers – double the average of 5.5 – and an additional four strong ones.
Overall, California has about double its normal snowpack, and some locations have experienced more than double the number of strong atmospheric rivers it typically sees. The result is that Northern Sierra snow water content is 197% of normal. The central region is 238% of normal, and the Southern Sierra is 296% of normal.
What risks does all that snow in the mountains create?
There is a lot of snow in the Sierra Nevada, and it is going to come off the mountains at some point. It’s possible we are going to be looking at snowmelt into late June or July in California, and that’s far into summer for here.
Flooding is certainly a possibility. The closest year for comparison in terms of the amount of snow would be 1983, when the average statewide snow water content was 60.3 inches in May. That was a rough year, with flooding and mudslides in several parts of the West and extensive crop damage.
This year, portions of the Southern Sierra Nevada have passed 1983’s levels, and Tulare Lake is filling up again for the first time in decades. Tulare Lake is an indication of just how extreme this year has been, and the risk is rising as the snow melts.
The transition from extreme drought in 2022 to record snow was fast. Is that normal?
California and some other parts of the West are known for weather whiplash. We frequently go from too dry to too wet.
2019 was another above-average year in terms of precipitation in California, but after that we saw three straight years of drought. We went from 13 strong or greater magnitude atmospheric rivers in 2017 to just three in 2020 and 2021, combined.
California relies on these storms for about half its water supply, but if the West gets too many atmospheric rivers back to back, that starts to have harmful impacts, like the heavy snowpack that collapsed roofs in the mountains this year, and flash flooding and landslides. These successive storms are typically referred to as atmospheric river families and can result in exacerbated hydrologic impacts by quickly saturating soils and not allowing rivers and streams to recede back to base flow between storms.
Are atmospheric rivers becoming more intense with a warming climate?
There’s been a lot of research on the impact of temperature because of how reliant California is on these storms for its water supply.
Atmospheric rivers are long, narrow corridors of water vapor in the sky that typically start in the tropics as water evaporates and is pulled poleward by atmospheric circulations. They carry a lot of moisture – on average, their water vapor transport is more than twice the flow of the Amazon River. When they reach land, mountains force the air to rise, which wrings out some of that moisture.
In a warming climate, the warmer air can hold more moisture. That can increase the capacity of atmospheric rivers, with more water vapor resulting in stronger storms.

Research by some of my colleagues at Scripps Institution of Oceanography also suggests that California will see fewer storms that aren’t atmospheric rivers. But the state will likely see more intense atmospheric rivers as temperatures rise. California will be even more reliant on these atmospheric rivers for its snow, which will result in drier dries and wetter wets.
So, we’re likely to see this whiplash continue, but to a more extreme level, with longer periods of dry weather when we’re not getting these storms. But when we do get these storms, they have the potential to be more extreme and then result in more flooding.
In the more immediate future, we’re likely headed into an El Niño this year, with warm tropical Pacific waters that shift weather patterns around the world. Typically, El Niño conditions are associated with more atmospheric river activity, especially in Central and Southern California.
So, we may see another wet year like this again in 2024.![]()
Chad Hecht, Research and Operations Meteorologist, Center for Western Weather and Water Extremes, University of California, San Diego
This article is republished from The Conversation under a Creative Commons license. Read the original article.
City Manager Kevin Ingram presented the discussion, explaining that last fall the council had requested a future discussion be planned on safe and sane fireworks sales within the city of Lakeport, the only place where such fireworks are allowed to be sold in all of Lake County, and only for several days before the Independence Day holiday.
Safe and sane fireworks are allowed to be sold in the city under the auspices of Measure C, a voter initiative passed in 2009 in response to an effort by the city to stop the sales.
The measure, which passed with a 60.6% yes vote, allows fireworks sales to be conducted by four local nonprofit groups each year.
Nonprofits in Lakeport have been allowed to sell safe and sane fireworks as an annual fundraiser for 53 years, raising a reported $2 million in that time, according to a representative of the Lake County Channel Cats, one of the nonprofits allowed to sell them.
“Over the years, residents have lodged complaints about the sale and use of fireworks, including County residents outside of the incorporated area of Lakeport. With the devastating wildland fires occurring in Lake County, the number of protests has continued to rise,” Ingram explained in his written report.
The Public Works and Lakeport Police Departments have placed signs at city limits warning that taking the fireworks out of the city is illegal, required sellers to give written notice that use of fireworks is limited to the incorporated boundaries of the city, and had “aggressive communications” across various city media platforms about fireworks related rules.
Ingram said the items’s purpose was to provide background and a platform for discussion.
“The council does not have the ability to make changes to Measure C as it is,” Ingram said, adding that changes would have to go through the initiative process.
During the discussion, Police Chief Brad Rasmussen said that illegal fireworks are an out of control problem not just locally but statewide.
Councilman Brandon Disney said he went to the Lakeport Fire Protection District and spoke to two different fire captains on separate shifts. Both told him that they’ve had no issues with safe and sane fireworks causing fires.
Nearly a dozen community members spoke on the issue; of those, only one, Supervisor Michael Green — who while still a council member last year had wanted the fireworks discussion to be held — spoke against continuing the sales.
The majority said the fireworks sales benefit nonprofits — including scholarship and swimming programs — and that they honor the country’s history and veterans.
Green said he’s witnessed safe and sane fireworks causing fires in the downtown, including in a trash can one year.
Illegal fireworks are a problem, Green said. “We give them effective cover with everyone blowing off their safe and sane fireworks,” he said, adding they’re an attractive nuisance.
He said it’s not good enough to keep allowing them because they haven’t started a major fire yet. “Because that’s the operative word — yet.”
Green suggested they look at the county’s stringent ordinance about fireworks, last updated in 2016, for guidance.
In response, Dennis Revell, speaking on behalf of his client, TNT Fireworks, pointed out that through Measure C, Lakeport’s voters put in place a much tougher ordinance than the county’s, with higher fines and other requirements. “That does not exist in the county regrettably.”
He said cities across California are having serious issues with illegal fireworks. Revell referenced a 45-minute illegal firework display on March 26 in the city of Los Angeles that authorities couldn’t stop.
“It has reached epidemic proportions,” he said.
Revell said that’s why Cal Fire, companies like TNT Fireworks and other stakeholders are working to get AB 1403 adopted and find a solution to stop the supply chain of illegal fireworks.
He emailed the City Council on Monday to offer several suggestions, including hiring private security firms to help patrol the city during the July 4 holiday.
Revell also proposed that a surcharge on the fireworks that the nonprofits charge be increased and that, along with support from TNT Fireworks, could help underwrite the costs of those enhanced security measures in the first year.
Lakeport Fire Chief Patrick Reitz said it was important not to confuse safe and sane fireworks and illegal fireworks, adding that responsible use is really where the problem lies.
Reitz recognized the benefits of the fireworks sales for Lakeport, from tourism to money for nonprofits.
Fire officials would like to see all of it go away. “The reality is, it’s not going to,” Reitz said, suggesting that people need to rely on each other to keep the community safe. At the same time, the fire department stands ready to do its part.
Councilman Kenny Parlet said after public comment, “You can’t always live in total fear,” adding that’s what has gone on for the past two and a half years, a reference to the pandemic.
Councilwoman Kim Costa said she disagreed with some of Parlet’s sentiments.
“Thinking about what may occur is what planning is about, and that’s why we’re here,” she said.
Costa said she aligns with Green, and thinks it’s crazy to have fireworks in a wildfire-prone area, when fire conditions are high in July.
However, she said she heard what people want, suggesting that maybe the best of all worlds is that the responsible citizens help educate others.
Disney said most of the issues the city experiences on July 4 is due to the amount of people, but he didn’t think the city wanted to limit the people who visit because of the benefits.
Regarding the threat of fireworks, “We have done a good job to keep it to a minimum and I want to continue that streak,” Disney said.
Referring to Revell’s suggestion about the additional regulatory fee and financial support for enforcement, Ingram said he’s spoken with City Attorney David Ruderman and increasing the financial surcharge would not require a voter-initiated change. He said staff could bring back more information on that proposal.
“I think that’s a great idea,” said Costa.
The council agreed by consensus to direct staff to bring back more information about the proposal.
Email Elizabeth Larson at
On Monday, April 17, LNU elevated to a staffing level II. This means the hiring of 79 firefighters that will be participating in the rehire academy at the Napa County Fire Training Center all week.
After successful completion of the academy, these firefighters will be moved to their assigned stations.
Peak staffing levels are not expected until the summer, dependent on resource needs to match fire conditions.
The oncoming firefighters allow the unit to staff 11 state engines. Of the 79 seasonal firefighters just hired, 37 of those will go to staff these engines.
The remaining 38 firefighters in this week’s rehire academy will be assigned to the hand crews
out of the Hood Mountain Fire Center in Sonoma County.
This is the second year in a row LNU will staff a fully equipped firefighter hand crew, which is comprised of one battalion chief, four fire captains, three fire apparatus engineers and the
firefighters.
Assignments for the hand crew will include day-to-day availability for emergency response and fuel reduction projects.
The 11 state engines in operation for staffing level II are out of the following stations:
• West Division: Santa Rosa, Hilton, Petaluma and Healdsburg.
• South Division: Spanish Flat, Napa, St. Helena and Gordon Valley.
• North Division: Middletown and Clearlake Oaks.
• East Division: Wilbur Springs.
Winter recap
LNU responded to 6,343 total incidents between Jan. 1 through March 31, an increase of 28% for incident response compared to the previous five-year average for the first three months of a year (LNU averaged 4,957 incidents from January-March between 2018-22).
LNU crews responded to increased storm-related emergencies and provided critical services, demonstrating their commitment to public service and community support.
Residential landscape burning status
Currently, in the State Responsibility Area, or SRA, where Cal Fire has jurisdictional authority, burning is allowed across the unit. Burn permits will begin being issued on or after May 1.
Applications can be submitted online at https://burnpermit.fire.ca.gov/ .
That same website contains important information on the requirements and safety precautions you need to know before burning.
It is the responsibility of residents to verify that it is a permissive burn day in your area by contacting your local air quality management agency and complying with any permitting process they may have.
Local air district contacts include:
• Spare the Air (Bay Area Air Quality Management District for southern Sonoma County & Napa County): 1-877-466-2876.
• Lake County Air Quality Management District: 707-263-7000.
• Northern Sonoma County Air Pollution Control District: 707-433-5911.
• Yolo-Solano Air Quality Management District: 530-757-3660 or 530-757-3787.
• Colusa County Air Pollution Control District: 530-458-0590.
It will be held between 9 a.m. and 2 p.m. in the public parking lot north of the Fifth Street boat ramp in downtown Lakeport.
This event is limited to city of Lakeport residents and business owners.
Those dropping off trash and solid waste will be required to provide photo identification and a copy of a current city utility bill.
Participants are asked to follow these guidelines:
• Stay in the vehicle while Lakeport Disposal staff unloads materials.
• Two visits maximum per each address.
Acceptable: Household trash; televisions; appliances (stoves, washers, dryers, dishwashers and water heaters); electronic waste; mattresses; household furniture; unusable clothes, blankets, towels; and similar materials.
Not acceptable: Refrigerators, hot tubs/spas, air conditioners, construction debris, used tires and household hazardous waste.
For more details, please visit the city’s website, www.cityoflakeport.com or its Facebook page, or contact Lakeport Disposal at 707-263-6080.
BERKELEY, Calif. — Rates of school discipline fluctuate widely and predictably throughout a school year and increase significantly faster for Black students than for their white counterparts, University of California, Berkeley, researchers have found.
A new study published today in the journal Proceedings of the National Academy of Sciences documents for the first time the “dynamic” nature of student discipline during an academic year.
Daily rates of punishment across all schools in the study ratchet up in the weeks before Thanksgiving break, decline immediately before major vacations and increase rapidly again when classes resume.
Schools with a high degree of racial disparity regarding discipline referrals or suspensions early in the year see discipline rates for Black students increase even faster as the semester continues, researchers found. By November, the Black student discipline rate is 10 times higher than at the beginning of the year. Compared to white students, it’s 50 times higher.
“This work is a game-changer,” said Jason Okonofua, assistant professor of psychology at UC Berkeley, and the study’s principal investigator. “We can predict year-long suspension rates in just the first 21 days of school. That's information that we needed to know. And now we do.”
Okonofua and his colleagues used improved daily discipline-tracking technology to study the snapshots of middle school punishments. Going forward, the granular information they gleaned can help educators keep tabs on escalating school tension. It can even help teachers and school officials ward off potential discipline-causing incidents, much like they modify a lesson plan to overcome a learning gap in the classroom.
“The more information you have, the better decisions you can make,” Okonofua said. “If principals or teachers know by Halloween in any given year these students are facing this very heightened risk of being kicked out of school, or in which schools these students face the highest risk, we can get in there and do something about it, as opposed to letting it fester.
“Because the data shows, it would.”
Long the focus of federal inquiries, policy debate and scholarly interest, school discipline disparities have been well-documented nationwide. Recent research has shown that high school students who are suspended are more than twice as likely to be charged or convicted of a crime and incarcerated as young adults. Brief online coursework for teachers can even increase empathy and reduce suspensions. Yet, the debate is increasing about whether school officials should be quicker to kick students out of class.
While cycles of school tension might seem intuitive, the focus historically has not been on measuring punishment rates in real-time or introducing interventions before incidents occur.
Instead, districts collect data on student discipline and produce year-end reports for state and federal regulators to examine how discipline varies among schools, which ones are more punitive and where to target interventions. While that “static” data provides a summary of what’s gone on throughout the year, it fails to capture the day-to-day realities at school.
To understand this more “dynamic nature” of student discipline, Okonofua and his colleagues assembled four years of data about the daily disciplinary experiences of 46,964 students across 61 middle schools in one of the 10 largest school districts in the country. The district was located in a southern U.S. state and, like an increasing number of organizations, it had implemented a more sophisticated discipline data tracking system.
The results — especially the disparities — were immediately startling.
“It is incredibly important, useful and valuable to know we should do a specific type of intervention at a specific point in the year based on the real-time data. That's where we're going to get the biggest bang for our buck,” Okonofua said. “If we can be more cost-efficient, everybody wins.”
Okonofua’s co-authors — Sean Darling-Hammond of UCLA, Michael Ruiz of UC Berkeley and Jennifer L. Eberhardt of Stanford University — also published a short video that uses beeping tones to illustrate discipline disparities between Black and white students. The anxiety-inducing tones are meant to simulate how stressful school can be when students are witnessing increasing discipline.
Okonofua likened school discipline tracking tools to an athlete’s heart rate monitor at the gym. Rather than simply estimating how hard a workout was, real-time data can be more useful.
“The more data we have, the more we know,” Okonofua said. “And the more we know, the more we can do.”
The study shows how important it is for districts to create systems for teachers to regularly monitor school discipline, he said. Policy leaders should likewise take note as they write policies and dedicate funding meant to curb discipline, alleviate disparities and minimize disruption.
“It's important to think about each data point. That's a whole story,” said Okonofua, reflecting on discipline's lasting effects on both the student in trouble and classmates witnessing the punishment. “I hope we can do as much as possible going forward to just keep in mind that each one of these data points is a whole life.”
Jason Pohl writes for the UC Berkeley News Center.