 How to resolve AdBlock issue?
News
May 2023 was quite warm across the contiguous U.S., ranking as the 11th-warmest May in the climate record.
The month also wrapped up a rather warm year so far, according to scientists from NOAA’s National Centers for Environmental Information.
Below are highlights from NOAA's U.S. monthly climate report for May 2023:
Climate by the numbers
May 2023
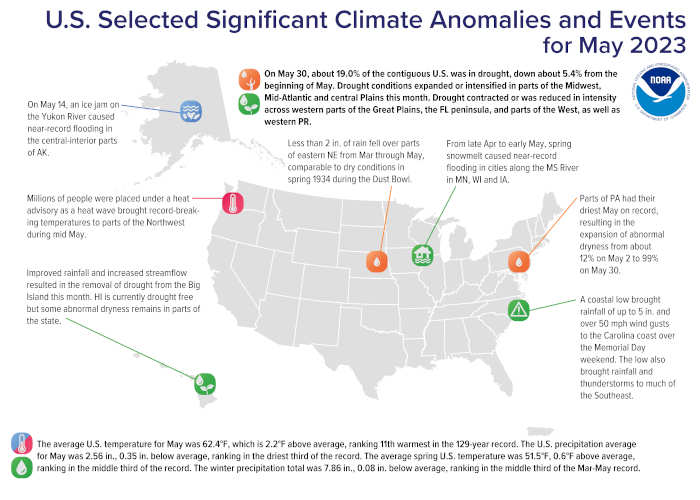
The average May temperature across the contiguous U.S. was 62.4 degrees F (2.2 degrees above the 20th-century average), ranking as the 11th-warmest May in NOAA’s 129-year climate record.
Temperatures were generally below average along the East Coast and above average across much of the West. Washington state had its warmest May on record while Minnesota, North Dakota, South Dakota and Wyoming each had a May that ranked as their top-5 warmest. Idaho, Montana and Oregon saw their fifth-warmest May, while South Carolina’s May was the state’s 10th-coolest.
The average precipitation for May was 2.56 inches (0.35 of an inch below average), which ranked in the driest third of the record.
Precipitation was above average across much of the western Plains and West and in parts of the Southeast and New England. Precipitation was below average from the Mississippi River Valley to the Mid-Atlantic and southern New England, and in parts of the Northwest and central Rockies. Wisconsin saw its fourth-driest May on record while Pennsylvania saw its fifth driest. Maryland and Michigan ranked eighth and ninth driest on record, respectively. No state experienced a top-10 wettest May on record.
Meteorological spring (March through May 2023) | Year to date
The average temperature for the contiguous U.S. during meteorological spring was 51.5 degrees F (0.6 of a degree above average), which ranked in the middle third of the climate record. Florida ranked fourth warmest while Massachusetts ranked 10th warmest on record for this spring season.
The spring precipitation total of 7.86 inches (0.08 of an inch below average) placed it in the middle third of the record. Maryland and Pennsylvania each ranked ninth driest on record while Kansas ranked 13th driest.
The average U.S. temperature for the year to date (YTD, January through May 2023) was 45.2 degrees F, 1.9 degrees above average, ranking as the 18th-warmest such YTD on record.
Precipitation for the first five months of 2023 totaled 12.82 inches — 0.43 of an inch above average — ranking in the middle third of the record. January-through-May 2023 ranked as Utah's 11th wettest and Nevada’s 13th wettest such period on record, while Maryland ranked fifth driest and Pennsylvania ranked 12th driest.
Other notable highlights from the report
Drought improved dramatically: According to the May 30 U.S. Drought Monitor reportoffsite link, 19.0% of the contiguous U.S. was in drought, down about 5.4% from the beginning of May 2023. Drought coverage in the contiguous U.S. has dropped nearly 44% over the last seven months, from 62.78% on November 11, 2022 to 18.95% on May 30, 2023 — the fastest reduction in drought coverage since the start of the U.S. Drought Monitor report and the smallest drought footprint since May 26, 2020.
A stormy May in some parts of the U.S.: Several notable weather systems produced severe thunderstorms and a number of tornadoes that impacted portions of the U.S. last month.
• May 7: A line of thunderstorms moved into southern Indiana and northern Kentucky. A total of six tornadoes was confirmed by NOAA’s National Weather Service (NWS), five of which occurred within a 15-minute span.
• May 11: A tornado outbreak occurred across areas of central Oklahoma. A total of nine tornadoes was confirmed by NWS, snapping utility poles and damaging homes.
• May 12: Severe thunderstorms produced several tornadoes, up to grapefruit-sized hail and flooding in parts of Nebraska. A total of 19 tornadoes, including three rated as EF-2, was confirmed by NWS.

The Research Brief is a short take about interesting academic work.
The big idea
People in the U.S. are dying at higher rates than in other similar high-income countries, and that difference is only growing. That’s the key finding of a new study that I published in the journal PLOS One.
In 2021, more than 892,000 of the 3,456,000 deaths the U.S. experienced, or about 1 in 4, were “excess deaths.” In 2019, that number was 483,000 deaths, or nearly 1 in 6. That represents an 84.9% increase in excess deaths in the U.S. between 2019 and 2021.
Excess deaths refer to the actual number of deaths that occur in a given year compared with expected deaths over that same time period based on prior years or, as in this study, in other countries.
In my study, I compared the number of U.S. deaths with those in the five largest countries in Western Europe: England and Wales, France, Germany, Italy and Spain. Those five countries make for a good comparison because they are nearly, if not quite, as wealthy as the U.S. and their combined population is similar in size and diversity to the U.S. population.
I also chose those countries because they were used in an earlier study from another research team that documented a 34.5% increase in excess deaths in the U.S. between 2000 and 2017.
The acceleration of this already alarming long-term trend in excess deaths in the U.S. was exacerbated by the fact that the U.S. experienced higher death rates from COVID-19 compared with similar countries. However, COVID-19 alone does not account for the recent increase in the number of excess deaths in the U.S. relative to comparison countries.
Why it matters
Rising living standards and medical advances through the 20th century have made it possible for people in wealthy countries to live longer and with a better quality of life. Given that the U.S. is the largest economic power in the world, with cutting-edge medical technology, Americans should have an advantage over other countries in terms of life span and death rates.
But in the last 50 years, many countries around the world have outpaced the U.S. in how fast death rates are declining, as revealed by trends in life expectancy.
Life expectancy is an average age at death, and it represents how long an average person is expected to live if current death rates remain unchanged throughout that person’s lifetime. Life expectancy is based on a complex combination of death rates at different ages, but in short, when death rates decline, life expectancy increases.
Compared to about 20 other high-income countries, since around the mid-1970s the U.S. life expectancy has been slipping from about the middle, or median, to the lowest rungs of life expectancy. So the relative stagnation in life expectancy in the U.S. compared with other countries is directly related to the fact that death rates have also declined more slowly in the U.S.
The U.S. has higher death rates than its peer countries due to a variety of causes. Cardiovascular disease prevalence has been an important driver of life expectancy changes across the globe in recent decades. But while death rates from cardiovascular disease have continued to decline in other parts of the world, those rates have stagnated in the U.S..
A key reason for this trend is the rise in obesity, as research shows that obesity increases the risk of death from cardiovascular disease. High prevalence of obesity in the U.S. also likely contributed to the relatively high death rates from COVID-19.
Another cause is that the U.S. has disproportionately high death rates from intentional injuries in the form of homicides, in particular those caused by firearms. Moreover, it also has high death rates from unintentional injuries, in particular drug overdoses.
What other research is being done
While these specific causes of deaths should clearly be health policy priorities today, there might be more fundamental causes to the elevated U.S. death rates.
In the early 1990s, young people in the U.S. between the ages of 15 and 34 were already dying at higher rates than their peers in other countries from a combination of homicides, unintentional injuries – in large part from motor vehicle accidents – and deaths from HIV/AIDS.
Research is underway to understand the more fundamental societal causes that may explain the vulnerability of the U.S. population to successive epidemics, from HIV/AIDS and COVID-19 to gun violence and opioid overdoses.
These include racial and economic inequalities, which combined with a weaker social security net and lack of health care access for all may help explain larger health and death disparities compared to European countries.![]()
Patrick Heuveline, Professor of Sociology, University of California, Los Angeles
This article is republished from The Conversation under a Creative Commons license. Read the original article.
The commission will meet at 5:30 p.m. Wednesday, June 14, in the council chambers at Lakeport City Hall, 225 Park St.
The council chambers will be open to the public for the meeting. Masks are highly encouraged where 6-foot distancing cannot be maintained.
The agenda is available here.
To speak on an agenda item, access the meeting remotely here; the meeting ID is 814 1135 4347, pass code is 847985.
To join by phone, dial 1-669-444-9171; for one tap mobile, +13462487799,,81411354347#,,,,*847985#.
Comments can be submitted by email to
On the agenda are three applications.
The first is for an architectural and design review and categorical exemption sought by Lake County Contractors to allow for the construction of a 7-foot-tall, galvanized chain link fence located at 301 and 401 Industrial Ave.
Next on the agenda is an application for another aspect of the revitalization and repurposing of the former Kmart building at 2019 S. Main St.
Upward Architects, which is renovating the building, is applying for the adoption of a master sign program review and categorical exemption that would include the construction of a 35-foot-tall sign as well as a 6-foot monument sign for the shopping center.
The new confirmed tenants are Tractor Supply and Marshalls, with a third tenant still to be determined.
The last of the applications the commission will consider is from Waterstone Residential, which is seeking a tentative parcel map that would allow for the subdivision of a 15-acre property into four separate lots at 1310 Craig Ave.
Waterstone is proposing to develop 128 apartment units and 48 cluster homes on the property, which includes the Parkside Subdivision next to Westside Community Park.
Email Elizabeth Larson at
The council will meet at 5 p.m. Thursday, June 15, for a budget workshop before the regular meeting begins at 6 p.m. in the council chambers at Clearlake City Hall, 14050 Olympic Drive.
The meeting will be broadcast live on the city's YouTube channel or the Lake County PEGTV YouTube Channel. Community members also can participate via Zoom or can attend in person. The webinar ID is 815 7524 1629.
One tap mobile is available at +16694449171,,81575241629# or join by phone at 669 444 9171 or 720 707 2699.
The agenda can be found here.
Comments and questions can be submitted in writing for City Council consideration by sending them to City Clerk Melissa Swanson at
To give the council adequate time to review your questions and comments, please submit your written comments before 4 p.m. Thursday, June 15.
The council will start off with a workshop on the 2023-24 budget at 5 p.m.
During the regular meeting, the council will meet the adoptable dogs and then hold a series of public hearings.
The hearings will include consideration of the appeal by the Koi Nation of Northern California of the Clearlake Planning Commission's April 25 approval of the environmental analysis of the city’s Burns Valley Development Project located at 14885 Burns Valley Road.
That matter has been continued from previous discussions at the council’s June 1 regular meeting and a special meeting on June 7.
The council also will hold a public hearing to adopt the 2023-24 fiscal year budget, the appropriations — or Gann — limit and the city’s fee schedule.
Under business, the council will consider a memorandum of understanding between the city and the Clearlake Middle Management Association from July 1, 2023 to June 30, 2024, and discuss the aware of a $113,800 contract with Case Excavating for the abatement of properties located at 3191 Sixth St., 3662 Cottonwood St., 16272 32nd Ave., 14870 Clement Drive, 3556 Madrone St., 14081 Woodland Drive, 3628 Johnson Ave., 16052 19th Ave., 3287 Third St. and 15582 Sharpe Lane.
On the meeting's consent agenda — items that are considered routine in nature and usually adopted on a single vote — are warrants; approval of an amendment to the agreement with Operating Engineers Public and Miscellaneous Employees Health and Welfare Trust Fund; and the minutes of the May 10 Lake County Vector Control District Board meeting.
The council will hold a closed session after the meeting to discuss a liability claim filed by Joseph Barrios and the lawsuit against the city by the Koi Nation of Northern California.
Email Elizabeth Larson at
El Niño is officially here, and while it’s still weak right now, federal forecasters expect this global disrupter of worldwide weather patterns to gradually strengthen.
That may sound ominous, but El Niño – Spanish for “the little boy” – is not malevolent, or even automatically bad.
Here’s what forecasters expect, and what it means for the U.S.
What is El Niño?
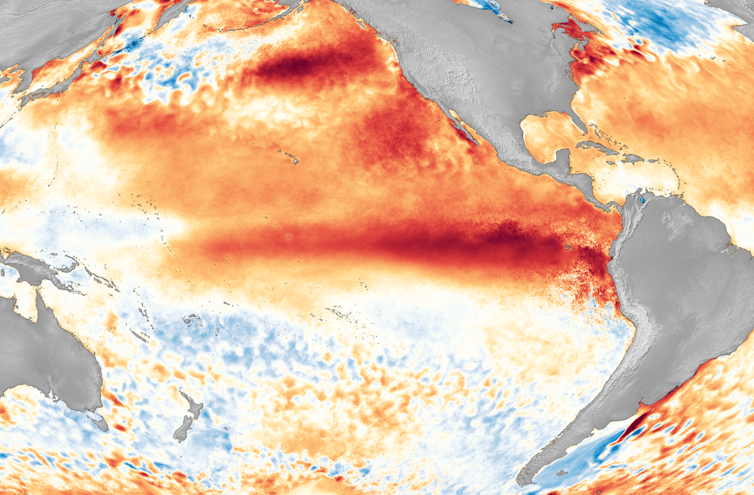
El Niño is a climate pattern that starts with warm water building up in the tropical Pacific west of South America. This happens every three to seven years or so. It might last a few months or a couple of years.
Normally, the trade winds push warm water away from the coast there, allowing cooler water to surface. But when the trade winds weaken, water near the equator can heat up, and that can have all kinds of effects through what are known as teleconnections. The ocean is so vast – covering approximately one-third of the planet, or about 15 times the size of the U.S. – that those sloshings of warm water have knock-on effects around the globe.
That warming at the equator during El Niño leads to the warming of the stratosphere, starting about 6.2 miles (10 kilometers) above the surface. Scientists are still studying how exactly this teleconnection occurs.
At the same time, the lower tropical stratosphere cools.
That combination can shift the upper-level winds known as the jet stream, which blow from west to east. Altering the jet stream can affect all kinds of weather variables, from temperatures to storms and winds that can tear hurricanes apart.
Basically, what happens in the Pacific doesn’t stay in the Pacific.
So, what does all that mean for you and me?
With apologies to Charles Dickens, El Niño tends to create a tale of two regions: the best of times for some, and the worst of times for others.
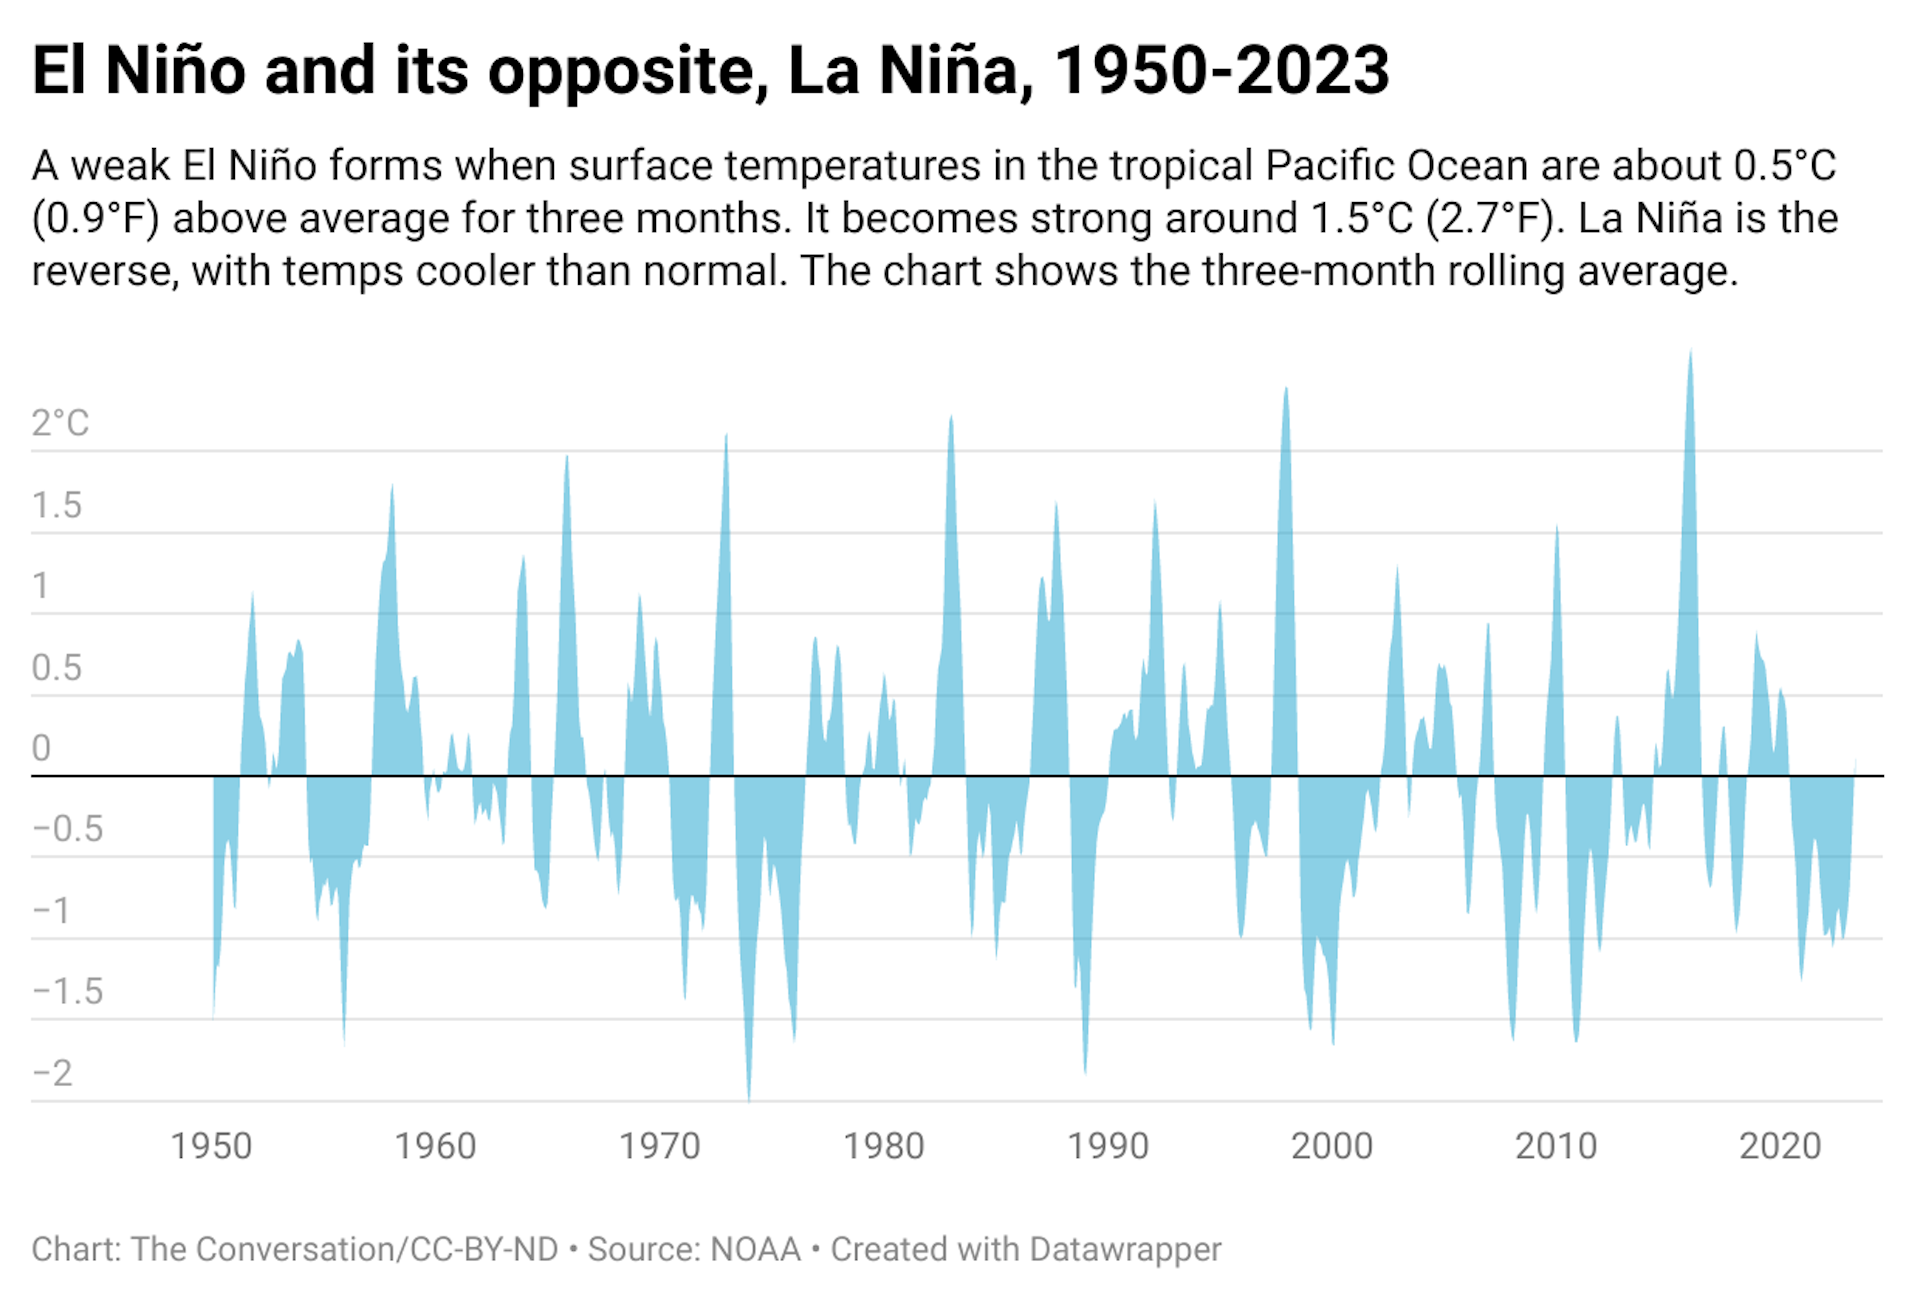
On average, El Niño years are warmer globally than La Niña years – El Niño’s opposite. Globally, a strong El Niño can boost temperatures by about 0.7 degrees Fahrenheit (0.4 Celsius). But in North America, there is a lot of local variation.
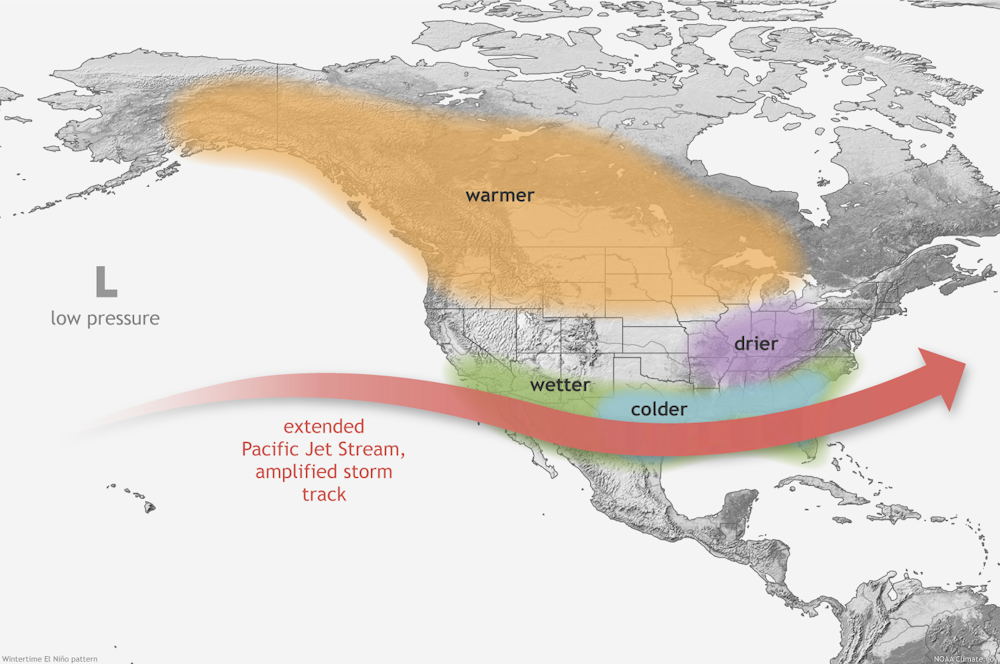
El Niño years tend to be warmer across the northern part of the U.S. and in Canada, and the Pacific Northwest and Ohio Valley are often drier than usual in the winter and fall. The Southwest, on the other hand, tends to be cooler and wetter than average.
El Niño typically shifts the jet stream farther south, so it blows pretty much due west to east over the southern U.S. That shift tends to block moisture from the Gulf of Mexico, reducing the fuel for thunderstorms in the Southeast. La Niña, conversely, is associated with a more wavy and northward-shifted jet stream, which can enhance severe weather activity in the South and Southeast.
El Niño also affects hurricanes, but in different ways in the Atlantic and Pacific.
Over the Atlantic, El Niño tends to increase wind shear – the change in wind speed with height in the atmosphere – which can tear apart hurricanes. But El Niño has the opposite effect in the eastern Pacific, where it can mean more storms. The ocean heat can also raise the risk of marine heat waves that can devastate corals and ecosystems fish rely on.
In the middle of the U.S., El Niño is generally associated with warmer and drier conditions that can mildly increase the chances of a bountiful corn crop.
In contrast, El Niño can wreak havoc on crops in Southern Africa and Australia and increase Australia’s fire risk with dangerously dry conditions. Brazil and northern South America also tend to be drier, while parts of Argentina and Chile tend to be wetter.

Of course, just because this is normally what happens doesn’t mean it happens every time. Witness California’s record rainfalls from multiple atmospheric rivers at the end of the last La Niña, which normally would mean dry conditions.
Every weather event is somewhat different, so the influence of El Niño is a matter of probability, not certainty. How El Niño and La Niña will be influenced over time by climate change isn’t yet clear.
The forecasts don’t all agree
Is 2023 going to be a record-breaking year? That’s the multibillion-dollar question.
The National Weather Service declares the onset of El Niño when water temperatures are at least 0.9 F (0.5 C) above normal for a three-month period in what’s known as the Niño3.4 region. That’s a large imaginary rectangle south of Hawaii along the equator.
For a strong El Niño, the Niño3.4 region needs to warm by 2.7 F (1.5 C) for three months. It’s not clear as of right now whether this El Niño will meet that threshold this year.
The National Oceanic and Atmospheric Administration’s first El Niño advisory of the year, released on June 8, sees an 84% chance of El Niño being greater than moderate by winter and a 56% chance that it will be strong.
Those forecasts can change, though, and different forecasting methods offer different forecasts of the magnitude.
“Dynamical” models, similar to the models used for typical weather forecasts, have projected a very strong El Niño, whereas “static” or statistical models are far less optimistic. Personally, I’m a statistical modeler, and my own model doesn’t suggest a strong El Niño in 2023. Rather, my model – like other static models – predicts that 2023 will fizzle out, and after a couple of quiet, or neutral, years, we will see a strong El Niño in 2026. I did get the recent unusual “triple dip” La Niña right, but I’m willing to be proved wrong by observations, as any good scientist should be.
But no computer model of any flavor has had experience with the globally super-high ocean temperatures that are occurring right now. The Atlantic is unusually warm, and that could offset some of the usual forces that come with El Niño.![]()
Bob Leamon, Associate Research Scientist, University of Maryland, Baltimore County
This article is republished from The Conversation under a Creative Commons license. Read the original article.
Newsom’s office said the amendment will leave the Second Amendment unchanged while respecting America’s gun-owning tradition.
“Our ability to make a more perfect union is literally written into the Constitution,” said Newsom.
He said the 28th Amendment he’s proposing “will enshrine in the Constitution common sense gun safety measures that Democrats, Republicans, Independents, and gun owners overwhelmingly support — while leaving the Second Amendment unchanged and respecting America’s gun-owning tradition.”
The 28th Amendment will permanently enshrine four broadly supported gun safety principles into the U.S. Constitution:
• Raising the federal minimum age to purchase a firearm from 18 to 21;
• Mandating universal background checks to prevent truly dangerous people from purchasing a gun that could be used in a crime;
• Instituting a reasonable waiting period for all gun purchases; and
• Barring civilian purchase of assault weapons that serve no other purpose than to kill as many people as possible in a short amount of time - weapons of war our nation’s founders never foresaw.
Additionally, the 28th Amendment will affirm Congress, states, and local governments can enact additional common-sense gun safety regulations that save lives.
Passage of the 28th Amendment will require a convention to propose amendments to the United States Constitution, also known as an Article V Convention or amendatory convention.
Working in partnership with members of the California State Senate and Assembly, California will be the first state in the nation to call for such a convention with a joint resolution being introduced by California State Senator Aisha Wahab and Assemblymember Reggie Jones-Sawyer.
The governor will work with grassroots supporters, elected and civic leaders, and broad and diverse coalitions across the nation to fight for the passage of similar resolutions in other state legislatures to ensure the convening of a constitutional convention limited to this subject.
Thirty-three other states, in addition to California, would need to take action to convene such a convention.
“I am proud to introduce this resolution to protect the common sense gun reform legislation our Assembly Public Safety Committee has championed over the years,” said Assemblymember Reggie Jones-Sawyer. “We cannot stand idly while courts roll back our work and diminish the ability of our Legislature to keep Californians safe. This bold but fair resolution calls on other states to join us in protecting some of the most effective ways of reducing gun violence.”
With gun violence claiming the lives of over 110 Americans a day, California’s nation-leading gun safety laws are showing positive results, according to recent studies.
In its most recent scorecard, California ranked as the No. 1 state for gun safety by the Giffords Law Center, and according to the most recent data, the state saw a 37% lower gun death rate than the national average.
The Centers for Disease Control and Prevention reported that California’s gun death rate was the 44th lowest in the nation, with 8.5 gun deaths per 100,000 people — compared to 13.7 deaths per 100,000 nationally, 28.6 in Mississippi, 20.7 in Oklahoma, and 14.2 in Texas.