How to resolve AdBlock issue?
News
The City of Clearlake Animal Association also is seeking fosters for the animals waiting to be adopted.
Call the Clearlake Animal Control shelter at 707-273-9440, or email
Visit Clearlake Animal Control on Facebook or on the city’s website.
The newest dogs are listed at the top of the following list.

‘Andy’
“Andy” is a male American pit bull mix with a short gray and white coat.
He is dog No. 48995415.

‘Annie’
“Annie” is a female Labrador retriever mix with a short black coat.
She is dog No. 49409961.

‘Arnold’
“Arnold” is a male American Staffordshire terrier mix with a short brindle coat with white markings.
He is dog No. 49029348.

‘Bear’
“Bear” is a male Labrador retriever-American pit bull mix with a short charcoal and fawn coat.
He has been neutered.
He is dog No. 48443153.

‘Bear No. 2’
“Bear No. 2” is a male American pit bull mix with a short tan coat.
He has been neutered.
He is dog No. 48731556.

‘Bella’
“Bella” is a female American pit bull mix with a short gray brindle coat.
She has been spayed.
She is dog No. 48448381.

‘Chai’
“Chai” is a female Alaskan husky mix with a gray and white coat.
She has been spayed.
She is dog No. 49279552.

‘Claire’
“Claire” is a female border collie mix with a short black and white coat.
She has been spayed.
Claire is dog No. 49397880.

‘Ebenezer’
“Ebenezer” is a male American pit bull terrier mix with a short tan and white coat.
He is dog No. 49191651.

‘Edgar’
“Edgar” is a male terrier-American pit bull mix with a black and cream coat.
He has been neutered.
He is dog No. 48634546.

‘Fritz’
“Fritz” is a male Australian shepherd mix with a black and white coat.
He is dog No. 49278179.

‘Isabella’
“Isabella” is a female Chihuahua mix with a short tan coat.
She is dog No. 49292130.

‘Jaxx’
“Jaxx” is a male Doberman pinscher mix with a black and rust-colored coat.
He has been neutered.
He is dog No. 49022184.

‘Levi’
“Levi” is a male golden retriever-Labrador retriever mix.
He has a short golden coat.
He is dog No. 48975687.

‘Maria’
“Maria” is a female Shar-Pei mix with a short tan coat.
She is dog No. 49047315.

‘Maui’
“Maui” is a male Labrador retriever mix with a short black coat and white markings.
He is dog No. 49334317.

‘Nala’
“Nala” is a 1-year-old female German shepherd mix.
She has a medium-length black and tan coat.
She is dog No. 48289638.

‘Noodle’
“Noodle” is a male Alaskan husky mix with a black and white coat.
He is dog No. 49375787.

‘Priscilla’
“Priscilla” is a female Brittany spaniel mix with a white and copper coat.
She is dog No. 49089138.

‘Sassy’
“Sassy” is a female American pit bull mix with a short black coat.
She has been spayed.
She is dog No. 48443128.

‘Snowball’
“Snowball” is a male American Staffordshire mix terrier with a white coat.
He is dog No. 49159168.

‘Terry’
“Terry” is a male shepherd mix with a short brindle coat.
He is dog No. 48443693.

‘Turk’
“Turk” is a male chocolate Labrador retriever mix.
He is dog No. 48911836.
Email Elizabeth Larson at
The California Department of Fish and Wildlife’s Cannabis Enforcement Program has released year-end numbers for the 2021 calendar year.
CDFW investigates illegal cannabis cultivation operations to uncover and curtail operations that result in significant environmental damage.
Some of the most serious environmental issues involve unauthorized streambed alterations with water diversions, habitat destruction, illegal use of pesticides and poaching.
CDFW does not typically investigate water theft but will assist county law enforcement partners in such investigations as needed.
“Illegal operators who are trying to bypass the legal system are a threat to California’s fish and wildlife resources, and a detriment to those legally cultivating cannabis,” said David Bess, CDFW deputy director and chief of the Law Enforcement Division. “Our wildlife officers did an exceptional job in providing public safety alongside our federal, state and county partners and I could not be prouder of their dedication and commitment to protecting the environment. Our year-end numbers are a testament to all their hard work throughout the year.”
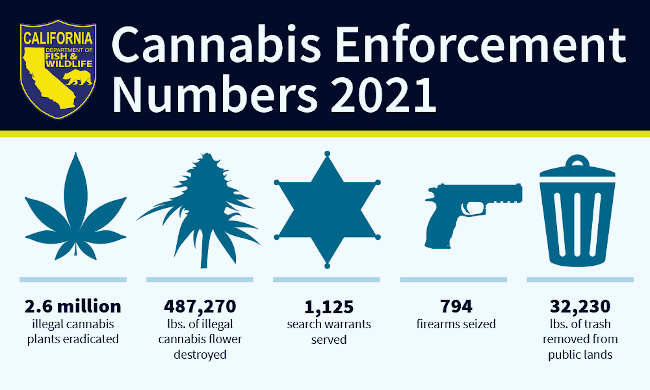
Some of the year’s notable statistics include:
• 2.6 million illegal cannabis plants eradicated;
• 487,270 lbs. of illegal cannabis flower destroyed;
• 1,125 search warrants served;
• 794 firearms seized;
• 32,230 lbs. of trash removed from public lands;
• 404 illegal water diversions removed.
These numbers reflect all operations where CDFW was either the lead agency or in a support role.
According to statistics from the Department of Justice’s Campaign Against Marijuana Planting program, or CAMP, illegal cannabis cultivation continues to move away from public land operations to private property.
In 2018, the ratio of illegal activity was approximately 80% on public lands and 20% on private property. The number of illegal cannabis grows on public lands has continued to decrease steadily over the last few years and in 2021, the Department of Justice’s CAMP program cited less than 30% of illegal cultivation activity on public lands.
CDFW has 68 dedicated cannabis enforcement officers who work with county, state and federal partners to combat illegal cultivation activity.
The agency encourages the public to report environmental crimes such as water pollution and poaching to the CalTIP hotline by calling 888-334-2258 or by texting information to “TIP411” (847411).
The blood supply in the U.S. is now at its lowest level in over a decade.
Many of the nation’s blood centers currently have only a one-day supply of some blood types in inventory. This is dangerous because blood transfusions are needed for many surgeries. Blood is also used in the treatment of diseases like sickle cell anemia and certain cancers – and is critical to help those who suffer injuries from accidents or disasters.
In January 2022, the American Red Cross declared its first-ever national blood crisis. A joint statement by the American Hospital Association, the American Medical Association and the American Nurses Association said that the “severity and duration of this shortage could significantly jeopardize the ability of health care providers to meet the many urgent needs of our patients and communities.”
A consistent supply of blood is essential to the nation’s health. Blood is a precious lifesaving product that cannot be manufactured but must be donated. No substitute for blood exists.
Each day the U.S. needs about 29,000 units of red blood cells, 5,000 units of platelets and 6,500 units of plasma, according to the American Red Cross. The average blood transfusion is for three units, with a victim of a car accident requiring as many as 100. A single donation can help more than one patient. Convalescent plasma may even be used as a treatment against COVID-19, a possibility our team has been researching.
I am a professor and director of the Virtual Center for Supernetworks at the University of Massachusetts Amherst. My expertise is supply chains, including perishable product supply chains such as blood. The COVID-19 pandemic, heading into its third year, has exacerbated the challenges associated with the nation’s blood supply chains. Let me explain.
Two years of dramatic change
At the onset of the pandemic in the winter of 2020, with growing fear and uncertainty, blood collections at many schools and other sites that traditionally hosted mobile blood drives closed. Throughout the nation, elective surgeries were canceled and procedures to preserve blood put into place.
Even before the pandemic, blood service organizations faced many challenges – including economic ones – and the U.S. blood supply chain was going through major shifts. In pre-pandemic times, less than 10% of the U.S. population would donate blood in a given year, although 38% were eligible. Moreover, blood is perishable, with red blood cells lasting 42 days, and platelets only five days, so regular replenishment is essential.
But in the past two years, since the World Health Organization declared the COVID-19 pandemic, unforeseen ripple effects have resulted in an immense demand for blood. Many people delayed medical treatment and may now be suffering from more advanced disease. An increase in gun violence, drug overdoses, automobile accidents – some due to driving under the influence as a consequence of pandemic-induced stress and challenges – and other trauma during the pandemic have also led to escalating demand for blood.
The American Red Cross reports that since March 2020, blood donations have decreased by 10%, with a decrease of 62% in college and high school blood drives as many of those locations went remote. This age group represented about a quarter of all the donors in 2019, with a drop to about 10% of all donors during the pandemic.
Most recently, donors who have tested positive with the highly transmissible omicron variant have had to cancel scheduled appointments for donating blood. The U.S. Food and Drug Administration recently released guidelines with updated information for blood establishments regarding blood donations in the pandemic. Donating blood is itself safe and, importantly, according to the FDA, globally there have been “no reported cases of transfusion-transmitted coronavirus, including SARS-CoV-2.”
The American Red Cross provides about 40% of the blood and blood components that are needed in the U.S.. Donors can also donate blood at local community blood centers or hospitals, at Vitalant – formerly United Blood Services – or at member organizations of America’s Blood Centers. These make up North America’s largest network of nonprofit community blood centers and operate more than 600 blood donation collection sites.

Not just numbers
When it comes to blood shortages, people’s lives are on the line, and the stories are very personal.
A young pregnant mother in Louisiana who was suffering from COVID-19 and internal bleeding survived just long enough to see her newborn daughter, thanks to blood donations. An 11-year-old girl in West Virginia who is battling bone cancer has received 18 blood transfusions. An 8-year-old girl in Texas is suffering from T-cell leukemia and relies on blood donations, but numerous blood drives in her area were canceled. These are just a few examples.
And the ability to receive regular transfusions is a matter of life or death for those with certain illnesses.
The many links involved in blood supply
The blood supply chain is incredibly complex. It consists of the collection of donations, testing, processing and distribution, with ultimate transfusion to recipients at health care facilities. Along with “getting blood from donor to recipient,” ample supplies are needed for collection, testing and transfusion.
Less well recognized, but of immense importance, is the labor required in this supply chain, which, along with the donors, serves as the backbone. Throughout the pandemic, workers have been getting sick from COVID-19 and many have, sadly, lost their lives. The reduction in labor availability, along with decreases in productivity, have affected supply chains from food to health care.
With COVID-19 infection rates surging across the nation, blood collection services are also suffering from labor shortfalls, including of blood collection specialists. The Red Cross is reporting that staffing shortages in parts of the country are among the biggest hurdles now, with higher wages being offered in this health care sector to attract workers.
[Over 140,000 readers rely on The Conversation’s newsletters to understand the world. Sign up today.]
Easing restrictions – such as those on gay and bisexual men – could increase the availability of blood by about 2% to 4%. This is now being considered. As we approach the third year of the pandemic, the need for blood donations and for supporting this complex supply chain is even greater than at the onset of the pandemic.![]()
Anna Nagurney, Professor and Chair in Integrative Studies, UMass Amherst
This article is republished from The Conversation under a Creative Commons license. Read the original article.
Agricultural Commissioner Steve Hajik completed the 2020 report, which was submitted to the Board of Supervisors late in 2021.
This will be the last crop report for Hajik, who retires this month after 20 years as agricultural commissioner. “That’s a record,” he told Lake County News. The previous record was 17 years.
He’ll be succeeded by Katherine Vanderwall, the deputy agricultural commissioner and sealer of weights and measures.
The 2020 crop report shows a major rollback of Lake County’s gross agricultural value, which was $75,471,368, down 30% from 2019.
Hajik’s report represents gross agricultural receipts and does not reflect production costs or net income to the producers.
He said Lake County’s agricultural value hasn’t been at this level since 2011, and is the result of market forces negatively and significantly impacting the winegrape, walnut and timber industries. At the same time, the continuing drought has impacted the field crops and cattle industries.
The county’s highest-ever ag value — $120,753,532 — was reached in 2017. Hajik said every year since then the value has declined.
In 2020, the top commodities were:
• Winegrapes: $52,509,710;
• Pears: $16,626,482;
• Miscellaneous livestock: $1,319,500;
• Cattle and calves: $1,234,000;
• Nursery production: $1,072,170;
• Walnuts: $1,047,600.
“Winegrapes account for most of the value of Lake County ag these days,” Hajik said.
The gross value of winegrapes in 2020 was down 37% from 2019. Hajik said issues impacting that industry included smoke damage and labor.
The report said the total winegrape tonnage was 39,520 and the total grape acreage was 10,009, a decrease of five acres. The tons per acre decreased by 16% and the average price per ton decreased by 26%.
Pears, the county’s No. 2 crop, actually fared better. That crop’s gross value in 2020 was $16,626,482, an increase of 13% from 2019. That gross value represents the value of the pears after they are packed and processed, and doesn’t indicate the value of the pears at the time of harvest or the gross income of the producers.
Total production decreased by 3,256 tons but the price per ton increased by 30%.
“Pears did well,” said Hajik.
He said he believes that was because of market changes brought on by COVID, with people staying home more and canned fruit operations doing quite well. “That’s my best guess.”
While pears had fewer acres, Hajik said the best acres remain in place.
The gross value of walnuts was $1,047,600, a decrease of 49% and the production decreased by 3%. The price per ton decreased by 43% and acreage remained the same, the report showed.
He expects the 3,500 acres of walnut acreage will be halved by 2022 due to the declining market.
Hajik pointed out a number of areas where there were increases. Among the most notable was miscellaneous livestock, which increased by 10,995%, rising from $110,000 to $1.2 million.
There also were increases in nursery production, 39%, and vegetables, 220%.
Decreases were reported in miscellaneous fruit; 4%; livestock and poultry production, 40%; cattle, 14%; field crops, 28%; and timber, 98%.
Hajik said timber went from $1.6 million to $31,000, which he attributed to fires and salvage logging, which is much cheaper than normal logging. “If you sold your timber now, you’d be losing money.”
For the first time, the crop report included industrial hemp, which Hajik said was done at the behest of Supervisor Bruno Sabatier.
He said Lake County only had three growers and eight acres of hemp. “It’s not really taking off.”
The report does not include cannabis, which for the purposes of reporting isn’t considered an agricultural crop, Hajik said.
The state, which is responsible for registering cannabis growers, has indicated it may be coming up with some basic information for agriculture commissioners to include in their reports, such as the number of growers, acres and value. So far, however, “That’s only talk,” Hajik said.
Asked about the biggest changes he’s seen in the report during his time as agriculture commissioner, Hajik said it’s the reduced acres of the pear industry.
In 2003, Lake County had 3,000 acres of pears. It’s now at 1,400 acres; Hajik said it’s expected the county will lose 200 more acres this year.
“The value of tons per acre has gone up,” Hajik said, rising from $348 per ton in 2003 to $733 per ton in 2020.
At the same time, grapes have almost doubled in acres and walnuts have stayed about the same. “Those are the biggest changes,” Hajik said.
Email Elizabeth Larson at
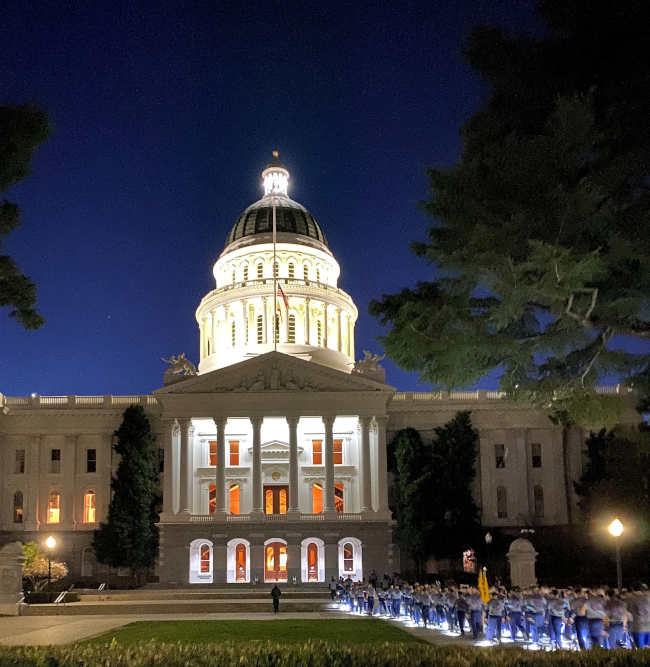
NORTHERN CALIFORNIA — The California Highway Patrol this week will graduate the latest cadet training class, which will provide new officers to CHP offices throughout the state.
The CHP said 142 members of Cadet Training Class I-21 participated in a five-mile run from the Academy in West Sacramento to the California Peace Officers’ Memorial early Wednesday morning.
This run is a ceremonial rite-of-passage for the cadets and signifies the end of their six-months of training, the CHP reported.
At the memorial, the CHP said the cadets honored the more than 1,600 law enforcement officers who came before them and made the ultimate sacrifice serving the people of California.
The CHP said it will swear in the new officers at a graduation ceremony at the CHP Academy on Friday.
Following the graduation ceremony, the new officers will serve in communities throughout the state.
Officer Efrain Cortez of the Clear Lake Area office said two of the new officers will be coming to Lake County and will start their training here.
There were 37.3 million people in poverty in 2020, according to the official poverty measure. In contrast, there were 29.8 million people in poverty that same year, according to the Supplemental Poverty Measure.
While these measures may seem at odds with each other, they each present a different angle of poverty in the United States.
In recognition of National Poverty in America Awareness Month this month, the U.S. Census Bureau is highlighting two poverty measures it uses to capture a clearer picture of poverty and equity in the United States.
The first — the official poverty measure first published in the mid-1960s — is based on cash resources.
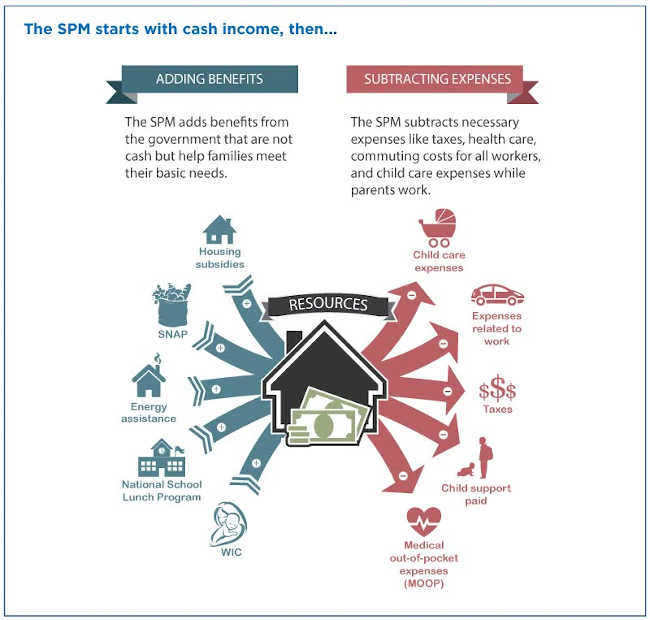
The second — the Supplemental Poverty Measure (SPM) — includes both cash and noncash benefits and subtracts necessary expenses (such as taxes and medical expenses).
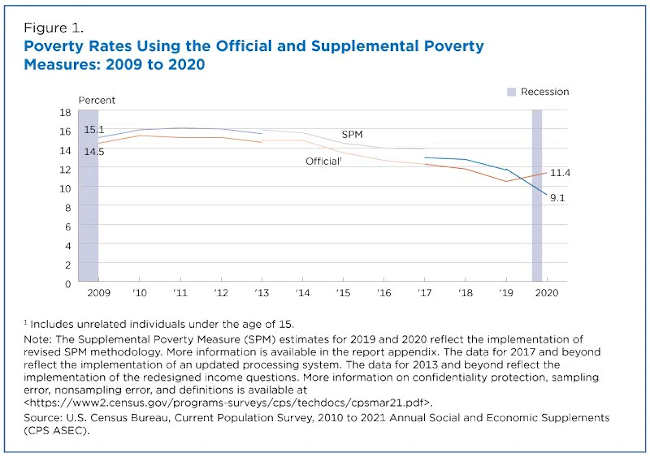
The 2020 SPM rate of 9.1%, the most recent available, was the lowest since the measure was first published in 2009, and the first time the SPM rate was lower than the official poverty rate.
Differences between poverty measures
The official poverty measure has remained mostly unchanged since the mid-1960s, but the SPM was designed to keep pace with changes in data, methods, and new research.
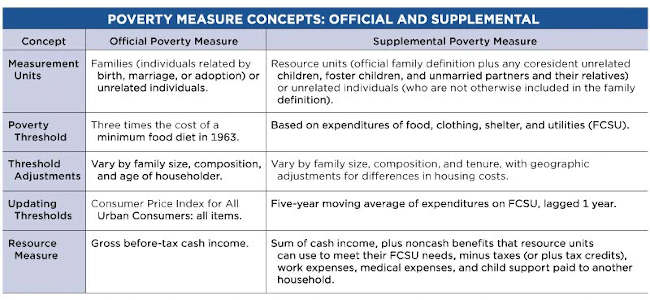
The table below shows a detailed comparison of major concepts between the two measures. (The history of poverty measures in the United States infographic, “How the U.S. Census Bureau Measures Poverty,” and this blog on the difference between SPM and official poverty measures provide more details.)
Official poverty measure
The official poverty measure compares an individual’s or family’s pretax cash income to a set of thresholds that vary by family size and the ages of family members.
These official poverty calculations do not account for the value of in-kind benefits such as nutritional assistance, housing and energy programs, or tax credits like the earned income tax credit or stimulus payments.
They also do not consider regional differences in living costs or expenses such as housing.
Supplemental poverty measure
On the other hand, the SPM does consider family resources and expenses not included in the official measure as well as geographic variation.
First, it adds the value of refundable tax credits and in-kind benefits available to buy basic goods to cash income. In-kind benefits include nutritional assistance, subsidized housing, and home energy assistance.
Then, it subtracts necessary expenses for critical goods and services not included in the thresholds from resources.
Necessary expenses subtracted include income taxes, Social Security payroll taxes, child care and other work-related expenses, child support payments to another household and medical care and health insurance premium contributions.
The Bureau of Labor Statistics’ Division of Price and Index Number Research produces the SPM income thresholds based on Consumer Expenditure Survey data that show how much people spend on basic necessities (food, clothing, shelter and utilities) and are adjusted for geographic differences in housing costs.
The SPM thresholds are not intended to assess eligibility for government assistance.
Official vs. supplemental poverty rates
In September 2021, the Census Bureau released the 11th SPM report for 2020. The report presented estimates of both the official and Supplemental Poverty measures and outlined differences between the two.
From 2009 through 2019, the SPM ranged from 0.6 to 1.6 percentage points higher than the official measure (Figure 1).
In contrast, the 2020 SPM was 2.3 percentage points lower than the official measure. This was the first time in the history of the SPM that its poverty rate was lower than the official poverty rate. SPM rates in 2020, which included stimulus payments, were at their lowest level since the first-published SPM estimates.
A recent America Counts story, “Who Was Lifted Out of Poverty by Stimulus Payments?”, showed that without stimulus payments, the supplemental poverty rate would have increased by approximately 3.6 percentage points.
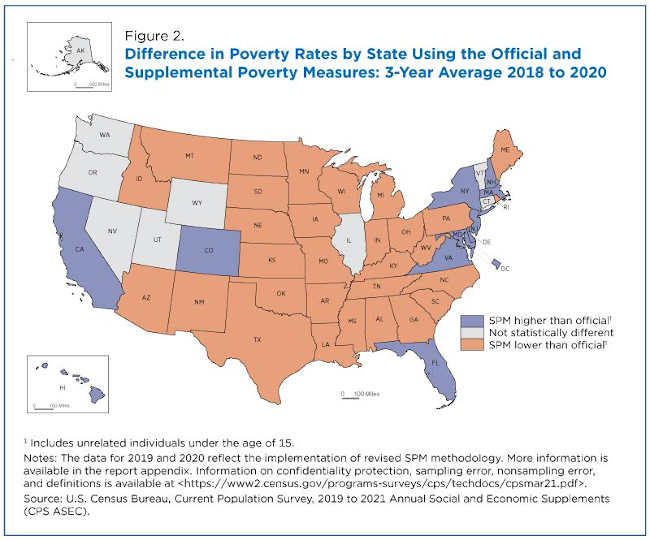
In 2020, SPM rates were:
• Higher than official poverty rates in 11 states plus the District of Columbia.
• Lower than official poverty rates in 30 states.
• Not statistically different in nine states.
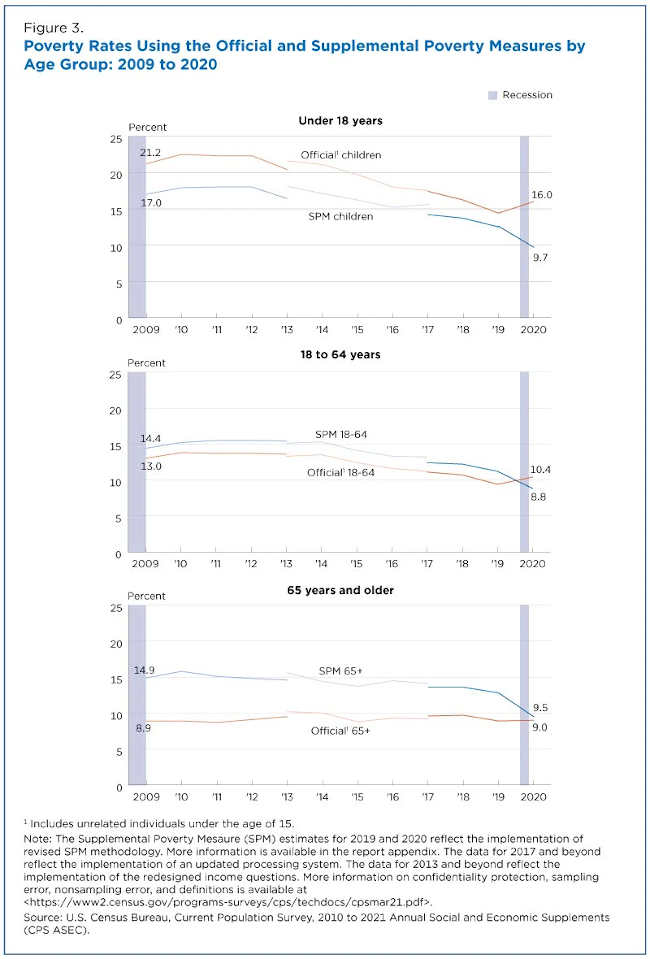
Poverty across age groups
While the SPM rate for children declined between 2019 and 2020, the official poverty rate increased over the same period, widening the gap between the two measures from 1.8 percentage points in 2019 to 6.3 percentage points in 2020 (Figure 3).
SPM rates for individuals ages 18 to 64 were also lower than official poverty rates in 2020, for the first time in the history of the SPM.
The gap between the official and SPM rates for individuals 65 and older declined from 3.9 percentage points in 2019 to 0.5 percentage points in 2020. SPM rates for each major age group in 2020 were at their lowest level since 2009.
Estimates in this story were calculated using the SPM universe, which includes unrelated individuals under age 15.
More details on the impact of policies and programs on the SPM rate are available in the 2020 SPM Report. Additionally, more information on confidentiality protection, methodology, sampling and nonsampling error and definitions is available.
Frances Chen is a survey statistician in the Census Bureau’s Poverty Statistics Branch. Kalee Burns is an economist in the Census Bureau’s Poverty Statistics Branch.