 How to resolve AdBlock issue?
News
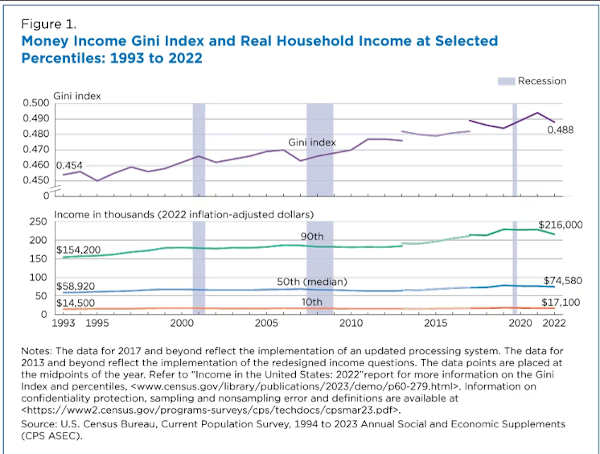
Figure 1. Money Income Gini Index and Real Household Income at Selected Percentiles: 1993 to 2022
Income inequality declined in 2022 for the first time since 2007, due primarily to declines in real median household income at middle and top income brackets, according to the newly released Income in the United States: 2022 report.
The report shows real median household income dropped 2.3% to $74,580 from 2021 to 2022.
U.S. Census Bureau data from the Current Population Survey Annual Social and Economic Supplement, or CPS ASEC, show that the declines in real income at the middle and top of the income distribution resulted in lower income inequality as measured by the Gini index — a common measure of income inequality.
Income inequality refers to how evenly income or income growth is distributed across the population. Higher income inequality represents less equal income distribution or growth.
The report provides several measures of inequality. In this article, we focus on changes in the Gini index and the ratios of income at different percentiles.
The Gini index measures income inequality ranging from 0 to 1 — reflecting the amount that any two incomes differ, on average, relative to mean income.
It is an indicator of how “spread out” incomes are from one another. A value of 0 represents perfect equality, meaning all households had the same amount of income. A value of 1 indicates total inequality, meaning that one household had all the income.
Using pretax money income, the Gini index decreased by 1.2% between 2021 and 2022 (from 0.494 to 0.488). This annual change was the first time the Gini index had decreased since 2007, reversing the 1.2% increase between 2020 and 2021 (Figure 1).
Since 1993 — the earliest year available for comparable measures of income inequality — the Gini index has increased 7.6%.
What drives income inequality
A decrease in the Gini index indicates that the distribution of income has become more equal. However, this indicator does not offer insight into how income inequality decreased.
The median represents the midpoint (50th percentile) of the income distribution. Comparing how incomes changed at different points along the income distribution can tell us what is driving income inequality.
The 2022 data suggest that declines in real income at the middle and top of the income distribution drove the decrease in the Gini index.
At the 90th percentile, 10% of households in 2022 had income above $216,000, down 5.5% from the 2021 estimate of $228,600.
However, at the 10th percentile, 10% of households had income at or below $17,100 in 2022, not statistically different from 2021 ($16,890).
The ratio of the 90th- to 10th-percentile (inequality between the top and bottom of the income distribution) decreased from 13.53 in 2021 to 12.63 in 2022. That means income at the top of the income distribution was 12.63 times higher than income at the bottom, a 6.7% decrease from 2021.
The ratio of the 90th- to 50th-percentile (inequality between the top and middle of the income distribution) also decreased — down 3.3% from 2.99 in 2021 to 2.90 in 2022.
The ratio of the 50th- to 10th-percentile (inequality between the middle and bottom of the income distribution) was not significantly different over this period, further indication that the lower end of the income distribution did not drive the change in inequality. Refer to the end of the story for notes about significance testing.
Pretax and post-tax measures
The Income in the United States: 2022 report also contains an appendix that compares pretax to post-tax income inequality measures.
Post-tax income is defined as money income after federal and state income taxes and credits, payroll taxes (FICA or Federal Insurance Contributions Act) and temporary cash payments administered by tax agencies, like state income tax rebates or stimulus payments.
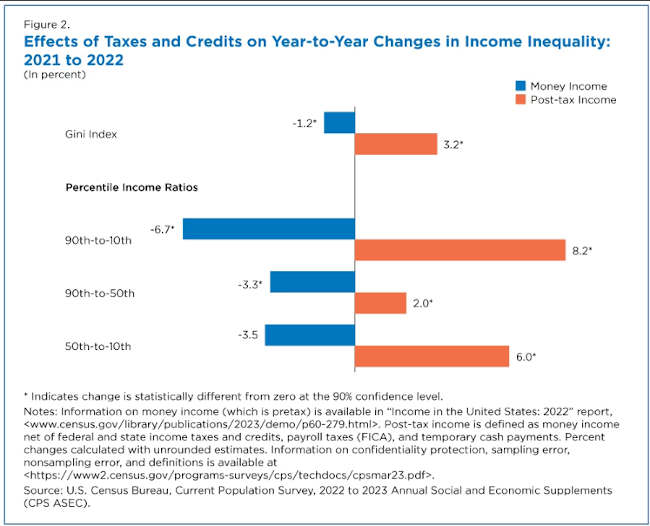
In contrast to the 1.2% decrease in the Gini index calculated using pretax income, the annual change in the Gini index calculated using post-tax income increased 3.2% from 2021 to 2022. These contrasting findings highlight the importance of definitions in understanding economic well-being.
Using post-tax income, the ratios of the 90th- to 10th-percentile, 90th- to 50th-percentile, and 50th- to 10th-percentile all increased between 2021 and 2022.
As Figure 2 shows, the ratio of the 90th- to 10th-percentile showed the largest post-tax income increase (8.2%), from 8.94 in 2021 to 9.67 in 2022.
Several policies expired in 2022, including Economic Impact Payments and the expanded Child Tax Credit introduced in response to the COVID-19 pandemic, which contributed to the increase in post-tax income inequality at the bottom of the income distribution.
Comparing inequality measures using pretax and post-tax income illustrates the impact the tax system can have on reducing inequality, as well as the importance of definitions in understanding trends in economic well-being and inequality. Using different definitions of income (pretax vs post-tax) will lead to different conclusions about the direction of inequality: pretax income inequality decreased while post-tax income inequality increased from 2021 to 2022.
Appendix B of the Income in the United States: 2022 report contains more information on post-tax income inequality measures. Definitions and information on confidentiality protection, methodology, and sampling and nonsampling error are available in the technical documentation.
All comparisons made here and in the report have been tested and found to be statistically significant at the 90% confidence level, unless otherwise noted. The following differences between the 2021–2022 percent changes in percentile income ratios were not statistically significant: 90th to 10th percentile and 90th to 50th percentile, and 90th to 50th percentile and 50th to 10th percentile.
Melissa Kollar is a survey statistician in the Census Bureau’s Income Statistics Branch.

Earthquakes, large and small, happen every single day along zones that wrap around the world like seams on a baseball. Most don’t bother anybody, so they don’t make the news. But every now and then a catastrophic earthquake hits people somewhere in the world with horrific destruction and immense suffering.
On Sept. 8, 2023, a magnitude 6.8 earthquake in the Atlas Mountains of Morocco shook ancient villages apart, leaving thousands of people dead in the rubble. In February 2023, a large area of Turkey and Syria was devastated by two major earthquakes that hit in close succession.
As a geologist, I study the forces that cause earthquakes. Here’s why some seismic zones are very active while others may be quiet for generations before the stress builds into a catastrophic event.
Earth’s crust crashes into itself and pulls apart
Earthquakes are part of the normal behavior of the Earth. They occur with the movement of the tectonic plates that form the outer layer of the planet.
You can think of the plates as a more or less rigid outer shell that has to shift to allow the Earth to give off its internal heat.
These plates carry the continents and the oceans, and they are continuously in slow-motion crashes with one another. The cold and dense oceanic plates dive under continental plates and back into Earth’s mantle in a process known as subduction. As an oceanic plate sinks, it drags everything behind it and opens a rift somewhere else that is filled by rising hot material from the mantle that then cools. These rifts are long chains of underwater volcanoes, known as mid-ocean ridges.
Earthquakes accompany both subduction and rifting. In fact, that is how the plate boundaries were first discovered.
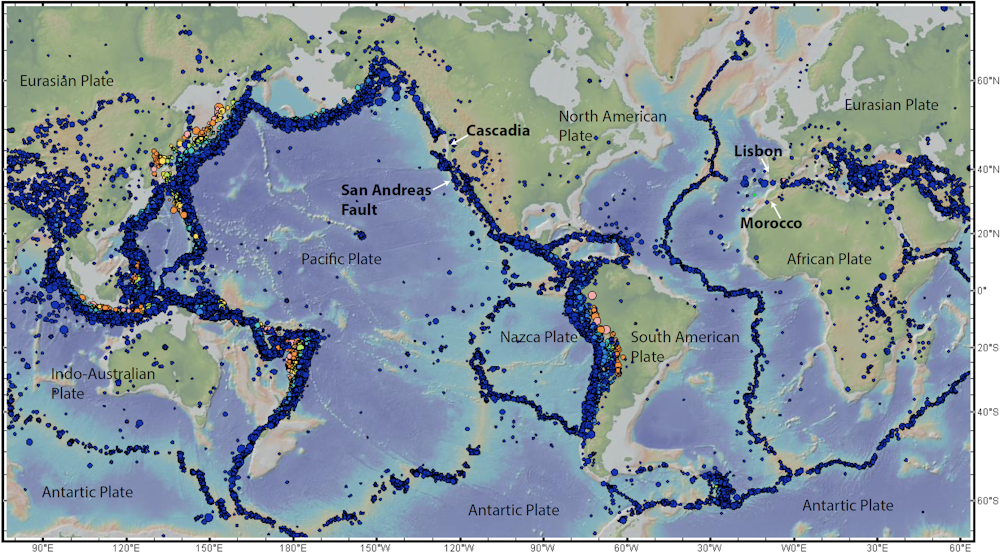
In the 1950s, when a global seismic network was established to monitor nuclear tests, geophysicists noticed that most earthquakes occur along relatively narrow bands that either fringe the edges of ocean basins, as in the Pacific, or cut right down the middle of basins, as in the Atlantic.
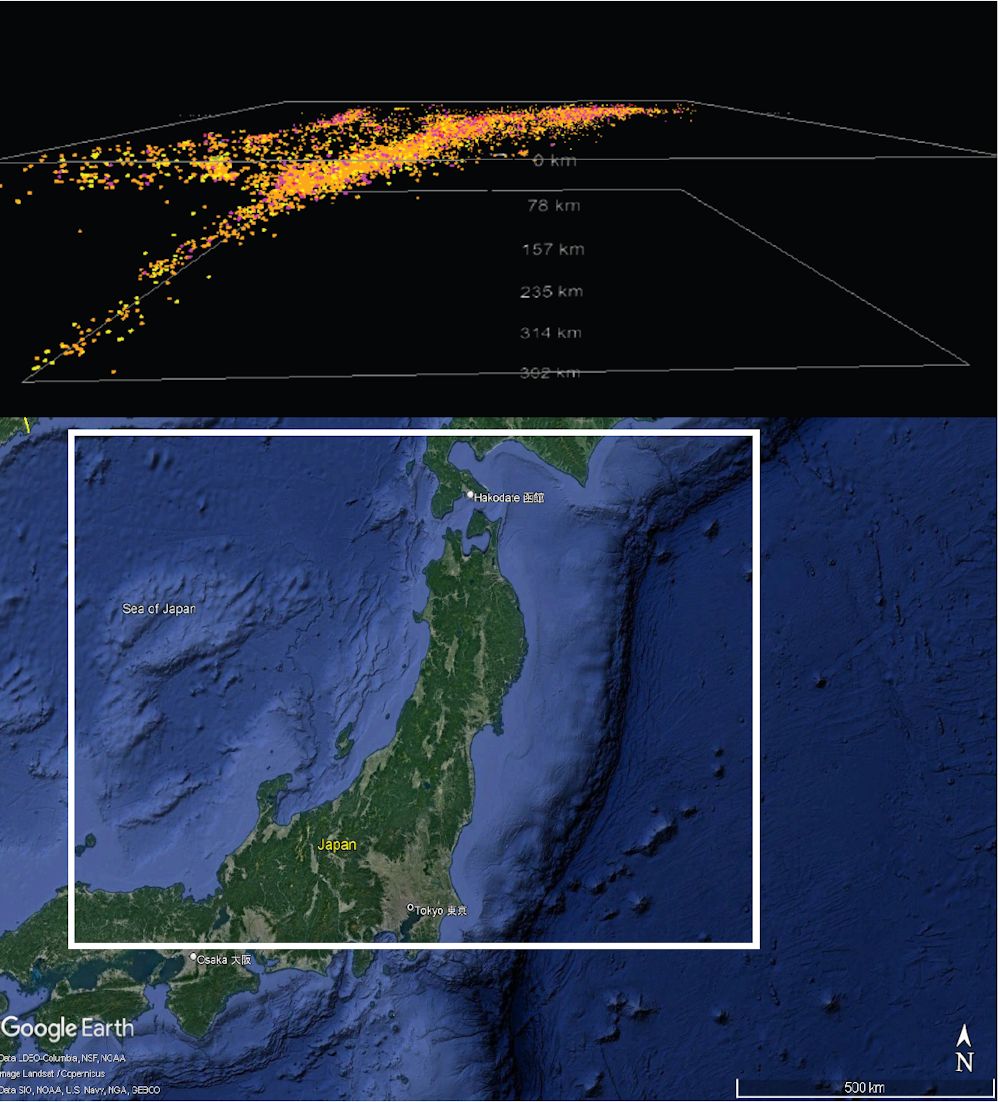
They also noticed that earthquakes along subduction zones are shallow on the oceanic side but get deeper under the continent. If you plot the earthquakes in 3D, they define slablike features that trace the plates sinking into the mantle.
An experiment: How an earthquake works
To understand what happens during an earthquake, put the palms of your hands together and press with some force. You are modeling a plate boundary fault. Each hand is one plate, and the surface of your hands is the fault. Your muscles are the plate tectonic system.
Now, add some forward force to your right hand. You will find that it will eventually jerk forward when the forward force overcomes the friction between your palms. That sudden forward jerk is the earthquake.
Scientists explain earthquakes using what’s known as the elastic rebound theory.
Fast plates move at up to 8 inches (20 centimeters) per year, driven mostly by the oceanic slabs sinking at subduction zones. Over time, they become stuck to each other by friction at the plate boundary. The attempted motion deforms the plate boundary zone elastically, like a loaded spring. At some point, the accumulated elastic energy overcomes the friction and the plate jerks forward, causing an earthquake.
But the plate-driving forces do not stop, so the plate boundary starts to accumulate elastic energy again, which will cause another earthquake – perhaps soon or perhaps far in the future.
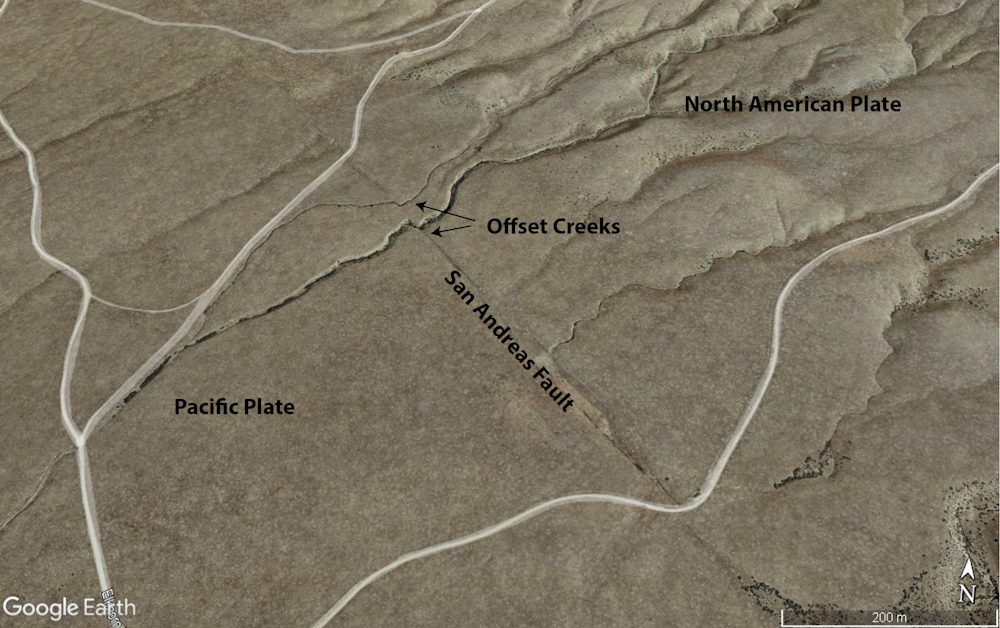
In the oceans, plate boundaries are narrow and well defined because the underlying rocks are very stiff. But within the continents, plate boundaries are often broad zones of deformed mountainous terrain crisscrossed by many faults. Those faults may persist for eons, even if the plate boundary becomes inactive. That is why sometimes earthquakes occur far from plate boundaries.
Earthquakes, fast and slow
The cyclic behavior of faults allows seismologists to estimate earthquake risks statistically. Plate boundaries with fast motions, such as the ones along the Pacific rim, accumulate elastic energy rapidly and have the potential for frequent large-magnitude earthquakes.
Slow-moving plate boundary faults take longer to reach a critical state. Along some faults, hundreds or even thousands of years can pass between large earthquakes. This allows time for towns to grow and for people to lose ancestral memory of past earthquakes.

The earthquake in Morocco is an example. Morocco is located on the boundary between the African and the Eurasian plates, which are slowly crashing into each other.
The huge belt of mountains that extends from the Atlas of North Africa to the Pyrenees, Alps and most of the mountains across southern Europe and the Middle East is the product of this plate collision. Yet because these plate motions are slow near Morocco, large earthquakes are not so frequent.
Preparing for the big one
An important fact about catastrophic earthquakes is that, in most cases, the earthquakes don’t kill people – falling buildings do.
Most Americans have heard of California’s San Andreas Fault and the seismic risk to San Francisco and Los Angeles. The last major earthquake along the San Andreas Fault hit at Loma Prieta, in the San Francisco Bay area, in 1989. Its magnitude, 6.9, was comparable to that of the earthquake in Morocco, yet 63 people died compared with thousands. That’s largely because building codes in these earthquake-prone U.S. cities are now designed to keep structures standing when the Earth shakes.
The exceptions are tsunamis, the huge waves generated when an earthquake shifts the seafloor, displacing the water above it. A tsunami that hit Japan in 2011 had horrific consequences, regardless of the quality of engineering in coastal towns.
Unfortunately, earthquake scientists can’t predict exactly when an earthquake might occur; they can only estimate the hazard.![]()
Jaime Toro, Professor of Geology, West Virginia University
This article is republished from The Conversation under a Creative Commons license. Read the original article.
Dear Readers,
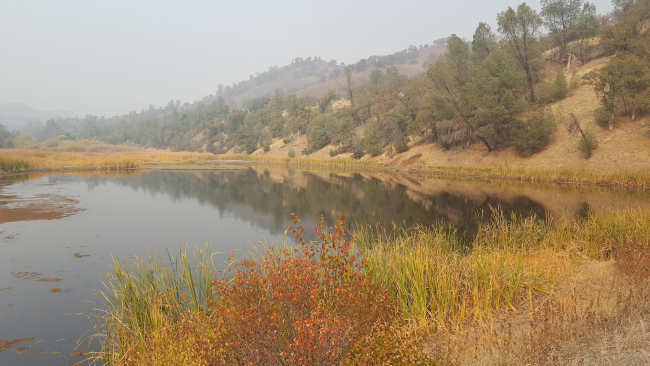
Now that Autumn is upon us, the landscapes will be changing. Lady of the Lake would like to remind you about the 2023 Lady of the Lake Photo Contest!
The annual contest was opened in spring, with submission closing Dec. 31, 2023.
The purpose of the photo contest is to get the readership to think about and appreciate lakes, rivers, creeks, and anything water in Lake County. Water holds a special beauty, especially paired with the beautiful contrast colors of fall. Now is the time to capture that beauty on camera.
Winners from each category will win a free breakfast or lunch (or Brunch!) with Lady of the Lake sponsored by Angelina’s Bakery on Main Street in Lakeport, CA. Photo winners will also be highlighted in the Lady of the Lake Column in the Lake County News. Every photo submitted to the contest will be eligible to be used in the Lake of the Lake Column alongside relevant column topics, with proper credit reference.
The rules are simple:
There are two submission groups; Novice and expert / professional.
There are two types of photo categories: Water and Wildlife.
Because this is the Lady of the Lake photos contest, all photos submitted have to include a lake, creek, stream, wetland, marsh, or pond. Landscapes and scenery will be included into the “water” category, and anything with an animal focus will be grouped into the “wildlife” category.
For example, a landscape shot of Clear Lake with birds flying in the sky will still be considered in the “water” category, but a close up of a grebe mating dance on Clear Lake, will be considered in the “wildlife” category.
This is a nature-centric photo contest. Humans, from a distance, can be included in photos, but their faces can not be close enough to be recognizable. For privacy, any photos with recognizable faces will be disqualified.
All photos must be sent as digital JPG / TIFF / PNG attachments or google drive links to the
When submitting photos, in the email subject line include: “Photo Contest _ group type_category” For example, if you are a novice submitting a photo of a river otter sunbathing on a rock, the subject of your photo would be “Photo Contest_novice_wildlife”. Save your photos files using your last name.
There is a limit to 3 photos submitted in each category by a single photographer, so a single photographer can submit a maximum of 6 photos, 3 in each category of water and wildlife.
Photos must not be more than 5 years old and taken within Lake County.
There are no restrictions on the type of camera used to take the photos, so feel free to use those camera phones as well as point and shoots and DSLRs.
Photos will be judged and ranked by a panel of three members of the community, yet to be confirmed. Judges will not be participants in the contest.
Good luck!
Sincerely,
Lady of the Lake
The Lady of the Lake column is written by Angela De Palma-Dow, a limnologist (limnology=study of fresh inland waters) who lives and works in Lake County. Born in northern California, she has a Masters of Science from Michigan State University. She is a Certified Lake Manager from the North American Lake Management Society (NALMS), the current president / chair of the California chapter of the Society for Freshwater Science, and a Lake County Certified Tourism Ambassador. She can be reached at

Summer 2023 was the hottest on record – yes, it’s climate change, but don’t call it ‘the new normal’

Summer 2023 was the hottest on record by a huge margin. Hundreds of millions of people suffered as heat waves cooked Europe, Japan, Texas and the Southwestern U.S. Phoenix hit 110 degrees Fahrenheit (43 degrees Celsius) for a record 54 days, including a 31-day streak in July. Large parts of Canada were on fire. Lahaina, Hawaii, burned to the ground.
As an atmospheric scientist, I get asked at least once a week if the wild weather we’ve been having is “caused” by climate change. This question reflects a misunderstanding of the difference between weather and climate.
Consider this analogy from the world of sports: Suppose a baseball player is having a great season, and his batting average is twice what it was last year. If he hits a ball out of the park on Tuesday, we don’t ask whether he got that hit because his batting average has risen. His average has gone up because of the hits, not the other way around. Perhaps the Tuesday homer resulted from a fat pitch, or the wind breaking just right, or because he was well rested that day. But if his batting average has doubled since last season, we might reasonably ask if he’s on steroids.
Unprecedented heat and downpours and drought and wildfires aren’t “caused by climate change” – they are climate change.
The rise in frequency and intensity of extreme events is by definition a change in the climate, just as an increase in the frequency of base hits causes a better’s average to rise.
And as in the baseball analogy, we should ask tough questions about the underlying cause. While El Niño is a contributor to 2023’s extreme heat, that warm event has only just begun. The steroids fueling extreme weather are the heat-trapping gases from burning coal, oil and gas for energy around the world.
Nothing ‘normal’ about it
A lot of commentary uses the framing of a “new normal,” as if our climate has undergone a step change to a new state. This is deeply misleading and downplays the danger. The unspoken implication of “new normal” is that the change is past and we can adjust to it as we did to the “old normal.”
Unfortunately, warming won’t stop this year or next. The changes will get worse until we stop putting more carbon dioxide and other greenhouse gases into the atmosphere than the planet can remove.
The excess carbon dioxide humans have put into the atmosphere raises the temperature – permanently, as far as human history is concerned. Carbon dioxide lingers in the atmosphere for a long time, so long that the carbon dioxide from a gallon of gasoline I burn today will still be warming the climate in thousands of years.
That warming increases evaporation from the planet’s surface, putting more moisture into the atmosphere to fall as rain and snow. Locally intense rainfall has more water vapor to work with in a warmer world, so big storms drop more rain, causing dangerous floods and mudslides like the ones we saw in Vermont, California, India and other places around the world this year.
By the same token, anybody who’s ever watered the lawn or a garden knows that in hot weather, plants and soils need more water. A hotter world also has more droughts and drying that can lead to wildfires.
So, what can we do about it?
Not every kind of bad weather is associated with burning carbon. There’s scant evidence that hailstorms or tornadoes or blizzards are on the increase, for example. But if summer 2023 shows us anything, it’s that the extremes that are caused by fossil fuels are uncomfortable at best and often dangerous.
Without drastic emission cuts, the direct cost of flooding has been projected to rise to more than US$14 trillion per year by the end of the century and sea-level rise to produce billions of refugees. By one estimate, unmitigated climate change could reduce per capita income by nearly a quarter by the end of the century globally and even more in the Global South if future adaptation is similar to what it’s been in the past. The potential social and political consequences of economic collapse on such a scale are incalculable.
Fortunately, it’s quite clear how to stop making the problem worse: Re-engineer the world economy so that it no longer runs on carbon combustion. This is a big ask, for sure, but there are affordable alternatives.
Clean energy is already cheaper than old-fashioned combustion in most of the world. Solar and wind power are now about half the price of coal- and gas-fired power. New methods for transmitting and storing power and balancing supply and demand to eliminate the need for fossil fuel electricity generation are coming online around the world.
In 2022, taxpayers spent about $7 trillion subsidizing oil and gas purchases and paying for damage they caused. All that money can go to better uses. For example, the International Energy Agency has estimated the world would need to spend about $4 trillion a year by 2030 on clean energy to cut global emissions to net zero by midcentury, considered necessary to keep global warming in check.
Just as the summer of 2023 was among the hottest in thousands of years, 2024 will likely be hotter still. El Niño is strengthening, and this weather phenomenon has a history of heating up the planet. We will probably look back at recent years as among the coolest of the 21st century.
This article was updated Sept. 15, 2023, with NOAA and NASA also confirming summer 2023 the hottest on record.![]()
Scott Denning, Professor of Atmospheric Science, Colorado State University
This article is republished from The Conversation under a Creative Commons license. Read the original article.
Dogs available for adoption this week include mixes of Belgian malinois, border collie, boxer, Cardigan Welsh corgi, German shepherd, Great Pyrenees, hound, pit bull, Siberian husky, schnauzer, shepherd and Yorkshire terrier.
Dogs that are adopted from Lake County Animal Care and Control are either neutered or spayed, microchipped and, if old enough, given a rabies shot and county license before being released to their new owner. License fees do not apply to residents of the cities of Lakeport or Clearlake.
The following dogs at the Lake County Animal Care and Control shelter have been cleared for adoption.
Call Lake County Animal Care and Control at 707-263-0278 or visit the shelter online for information on visiting or adopting.

‘Faith’
“Faith” is a 2-month-old female husky puppy with a gray and white coat.
She is in foster care, ID No. LCAC-A-5648.

‘Teddy’
“Teddy” is a 12-year-old male Yorkshire terrier-schnauzer mix with a tricolor coat.
He is in kennel No. 2, ID No. LCAC-A-1896.

Male Great Pyrenees
This 1 and a half year old male Great Pyrenees has a white coat.
He is in kennel No. 3, ID No. LCAC-A-5469.

Boxer-pit bull puppy
This 2-month-old male boxer-pit bull puppy has a short tan coat with black and white markings.
He is in kennel No. 5a, ID No. LCAC-A-5806.

Boxer-pit bull puppy
This 2-month-old male boxer-pit bull puppy has a short tan coat with black and white markings.
He is in kennel No. 5b, ID No. LCAC-A-5807.

Male border collie
This 1-year-old male border collie has a black and white coat.
He is in kennel No. 9, ID No. LCAC-A-5643.

Male pit bull terrier-hound puppy
This 6-month-old male pit bull terrier-hound puppy has a black coat with white markings.
He is in kennel No. 12, ID No. LCAC-A-5834.

Cardigan Welsh corgi
This 1-year-old male Cardigan Welsh corgi has a brown and tan coat.
He is in kennel No. 14, ID No. LCAC-A-5882.

Hound-pit bull terrier
This 6-month-old male hound-pit bull terrier puppy has a black coat with white and tan markings.
He is in kennel No. 15a, ID No. LCAC-A-5831.

Hound-pit bull terrier
This 6-month-old male hound-pit bull terrier puppy has a white coat with gray markings.
He is in kennel No. 15b, ID No. LCAC-A-5832.

Male German shepherd
This 5-year-old male German shepherd has a long black and tan coat.
He is in kennel No. 17, ID No. LCAC-A-5875.

Male pit bull terrier
This 3-year-old male pit bull terrier has a short brown coat.
He is in kennel No. 18, ID No. LCAC-A-5835.

Male pit bull
This 1-year-old male pit bull has a short brindle coat.
He is in kennel No. 21, ID No. LCAC-A-5616.

Male shepherd
This 2-year-old male shepherd has a black and tan coat.
He is in kennel No. 22, ID No. LCAC-A-5423.

Male Siberian husky
This 4-year-old male Siberian husky has a brown and tan coat.
He is in kennel No. 24, ID No. LCAC-A-5891.

Male shepherd
This 1 and a half year old male shepherd has a short tricolor coat.
He is in kennel No. 26, ID No. LCAC-A-5424.

Female German shepherd
This 7-year-old female German shepherd has a black and tan coat.
She is in kennel No. 30, ID No. LCAC-A-5629.

‘Chikis’
“Chikis” is a 5-year-old female boxer with a short brown coat.
She is in kennel No. 32, ID No. LCAC-A-3672.

‘Nana’
“Nana” is a 2-year-old female shepherd mix with a short yellow coat.
She is in kennel No. 33, ID No. LCAC-A-5277.

‘Xina’
“Xina” is a 3-year-old female Belgian malinois with a brown and black coat.
She is in kennel No. 34, ID No. LCAC-A-462.
Email Elizabeth Larson at
The Lake County Registrar of Voters office encourages Lake County residents to make sure they are registered to vote or update their voter registration information.
Eligible residents can register to vote online at https://registertovote.ca.gov/ or at the Lake County Registrar of Voters office at 325 N. Forbes St. in Lakeport.
Voter registration forms are also available at all Lake County libraries and post offices.
If you require a voter registration form be mailed to you, call the Registrar of Voters Office at 707-263-2372.
Eligible students, ages 16 and 17, can be civically engaged by preregistering to vote.
If students preregister to vote, they will automatically become voters when they turn 18 years old.
National Voter Registration Day efforts are designed to ensure every eligible voter has the opportunity to register to vote or update their voter registration information in order to be prepared for future elections.
For additional information, call the Registrar of Voters Office at 707-263-2372.