 How to resolve AdBlock issue?
News
- Details
- Written by: LAKE COUNTY NEWS REPORTS

CLEARLAKE, Calif. — The Clearlake Police Department is asking for the community’s assistance in locating a missing teenager.
Police are trying to find 17-year-old Jade Monger.
Monger is described as a white female juvenile, with short curly blonde, blue and red hair and brown eyes.
She stands 5 feet 6 inches tall and is 200 pounds.
Monger was last seen in Clearlake, at which point she was wearing a black shirt with skulls on it, light blue shorts and white vans.
If you have any information regarding her whereabouts, please contact the Clearlake Police Department at 707-994-8251, Extension 1.
- Details
- Written by: Shannon Sabo and Sandra Johnson
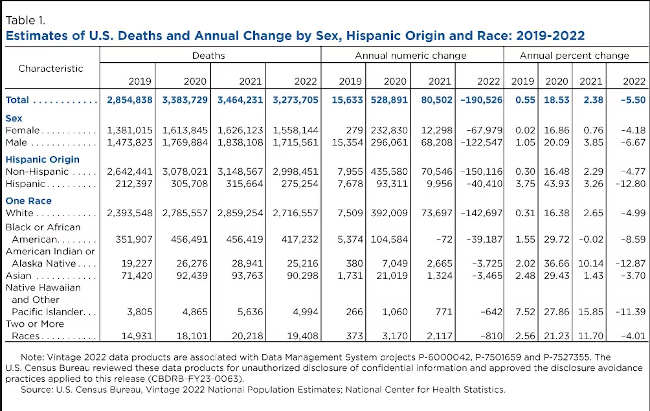
Males and the Hispanic, American Indian and Alaska Native (AIAN) populations experienced a disproportionately large number of deaths from 2019 to 2020, the year that includes the start of the COVID-19 pandemic.
Deaths for the total U.S. population increased 19% in 2020, but some groups were more affected than others, according to the U.S. Census Bureau’s Vintage 2022 Population Estimates released today — the first to contain final 2020 mortality data by demographic characteristics.
Increases in deaths during 2020 were reflected in previous estimates releases, but the latest data show the disproportionate impact of the pandemic on mortality by race/ethnicity and sex.
How we measure deaths
The U.S. Census Bureau’s annual estimates are based on final 2020 data and provisional totals from the National Center for Health Statistics, or NCHS.
To capture more recent trends in deaths during the entire estimates series (April 1, 2020-July 1, 2022), including those from the pandemic, we relied on newly available 2021 final data and 2022 provisional data from NCHS.
These data are subject to revision. The patterns described here, specifically for 2022, may differ slightly from those included in our next vintage estimates (Vintage 2023) which will be updated with final data.
Mortality trends by characteristics
There were large increases in deaths across all demographic groups between 2019 and 2020, and smaller increases for most groups from 2020 to 2021 (Table 1). Deaths declined for all groups from 2021 to 2022.
Mortality by sex
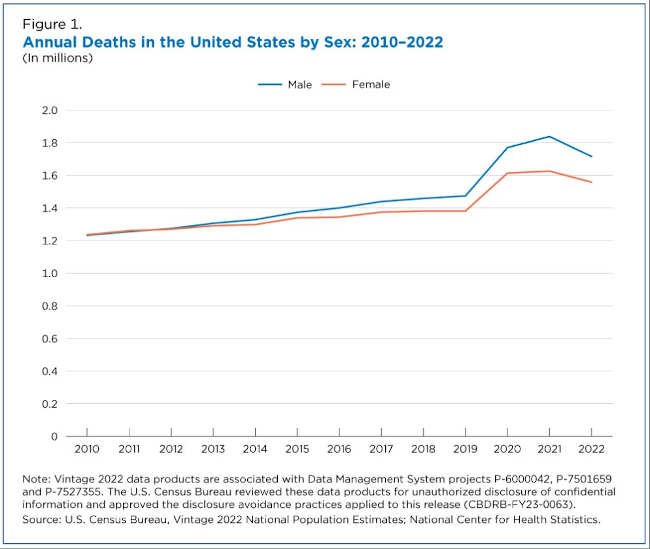
Males have historically had higher deaths than females and for most of the last decade, the gap between the two sexes had been growing prior to the pandemic (Figure 1). In 2012, for example, 50.1% of deaths were male. By 2019, the share had increased to 51.6%.
Between 2019 and 2020, male deaths increased by 296,061 (20.1%) and female deaths by 232,830 (16.9%). The trend continued in 2021, with 68,208 (3.9%) more male deaths and 12,298 (0.8%) more female deaths.
In 2021, 53.1% of those who died were male. Provisional 2022 NCHS data show larger declines for males but the share of male deaths (52.4%) was still larger than in pre-pandemic years.
The growing difference in deaths between males and females in 2020 and 2021 suggests the COVID-19 pandemic had a larger impact on the mortality of males than it did on females.
Hispanic origin
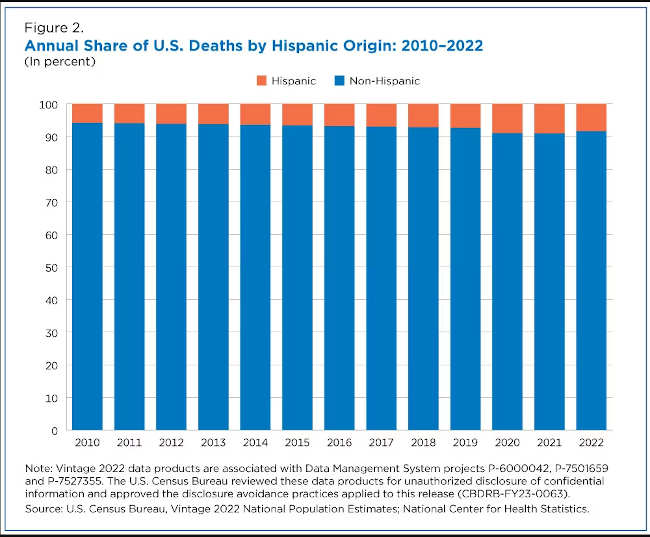
Because the Hispanic population comprises a much smaller share of the total population relative to the non-Hispanic group, the majority of deaths are non-Hispanic (Figure 2).
Similarly, as the share of the Hispanic population increased from 2010 to 2020, so did the share of deaths among this group, which went from 6.2% in 2012 to 7.0% in 2017 and 7.4% in 2019.
The increase in Hispanic deaths between 2019 and 2020, however, represents a notable break in the time series, jumping from 7.4% to 9.0% of all deaths in a single year. The Hispanic population’s share of mortality increased again (9.1%) in 2021, the first full year of the pandemic.
The increase in Hispanic mortality during the pandemic was higher relative to the non-Hispanic U.S. population, though it declined slightly to 8.4% of total deaths in 2022, according to provisional data.
Race groups
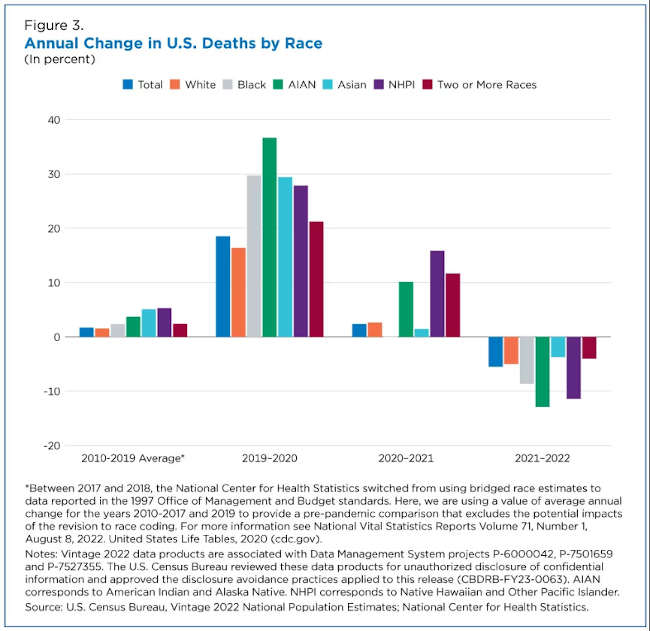
All race groups had higher-than-normal increases in deaths from 2019 to 2020 (Figure 3). But during the pandemic’s first year, every race group other than the White population experienced single-year percentage increases higher than the 18.5% increase in deaths for the total population.
Prior to the pandemic, mortality increases in the previous decade were relatively small and did not vary as much annually across races (Figure 3).
Figure 3 highlights the following trends in mortality rates:
• In 2020, the largest mortality increase occurred in the American Indian and Alaska Native population (36.7%), followed by the Black (29.7%) and Asian (29.4%) populations.
• In 2021, there was more variation in the magnitude and direction of change across groups. Black deaths decreased by less than 1% between 2020 and 2021, while the Native Hawaiian and Other Pacific Islander (15.9%), Two or More Races (11.7%), and American Indian and Alaska Native (10.1%) populations continued to experience larger percentage increases in deaths than the total population.
• White deaths (2.65%) were also slightly higher than the total increase (2.38%).
• Provisional 2022 data show declines in mortality for all race groups between 2021 and 2022, with the largest declines occurring among the American Indian and Alaska Native (-12.9%) and Native Hawaiian and Other Pacific Islander (-11.4%) populations.
Pandemic’s impact on national deaths
The data released offer the most comprehensive look at the impact of COVID-19 mortality in the Census Bureau’s annual population estimates series to date.
Final 2020 data allowed us to account for mortality differences across race groups during the early years of the pandemic. As more final data become available, we will continue to revise the estimates and improve our understanding of how the pandemic affected the nation’s population.
Of particular interest is whether the declines in deaths for 2022 shown in provisional data will result in a return to pre-pandemic levels for mortality, similar to what we are observing for international and domestic migration.
Shannon Sabo is a statistician/demographer in the Census Bureau’s Population Division. Sandra Johnson is chief of the Population Division’s Population Evaluation, Analysis, and Projections Branch.
- Details
- Written by: Patrick Rooney, Indiana University; Anna Pruitt, Indiana University, and Jon Bergdoll, Indiana University

Charitable giving in the U.S. fell to US$499 billion in 2022, as donors dealt with their losses in the stock market and coped with 40-year high inflation rates.
For only the fourth time on record, Americans gave less than they did the previous year without accounting for inflation, according to the newest annual Giving USA report. The research, released by the Giving USA Foundation, in partnership with the Indiana University Lilly Family School of Philanthropy, found that total giving fell 10.5% in inflation-adjusted terms, the steepest decline since the Great Recession of 2007-2009. Giving in nominal dollars, without that adjustment, dropped by 3.4%.
Giving declined across the board with lower levels of donations from individuals, foundations, the estates of deceased donors, and corporations – when accounting for inflation.
As an economist with over 20 years of experience in analyzing this data and two of the report’s lead researchers, we find that three factors lead to these rare results: the comparative strength of giving in prior years, U.S. economic conditions and inflation. Giving to nearly every kind of charity fell in 2022.
Giving dropped from a record high
Giving in 2021 was even stronger than we first estimated, reaching $517 billion that year, surpassing half a trillion dollars for the first time. This revision was based primarily on updates that the U.S. government makes to tax data – an annual practice.
In 2021, individual donors, foundations and corporations were motivated to respond to the COVID-19 pandemic. That all-time high for U.S. giving was facilitated by the stock market’s strong performance, which began in late 2020, and robust economic growth.
The large total amount that Americans gave to charity in 2021, which followed another strong year in 2020, helps to explain why giving declined so much in 2022. Donations fell in 2022 from unusually high levels reached when Americans responded to needs that arose due to the pandemic and calls for social justice.
Donors at all income levels likely scaled back
Individual donors, who comprise the largest share of giving, gave $319 billion in 2022 – 13.4% less than they did in the previous year after adjusting for inflation. Unlike in recent years, when market gains boosted the net worth of wealthy Americans, the stock market fell in 2022 by more than any year since 2008, reducing the net worth of many U.S. households.
Rich people typically give less to charity when the stock market suffers. That held true in 2022, according to multiple sources.
Despite declines in the stock market, the job market in 2022 was strong – which can be a good sign for the financial stability of less affluent households. Employment levels rose, with the jobless rate dipping to about 3.5%.
Wages also grew in 2022; however, that growth did not keep up with inflation. Instead, many Americans were forced to use their savings to stay on top of their bills, as they paid more for food, housing and other expenses.
The Giving USA data shows that people give about 2% of their disposable personal income – the money available after they pay taxes – to charity. Because inflation-adjusted disposable personal income fell by more than 6% in 2022, Americans had less money to give away.
Inflation eroded the value of all gifts
U.S. inflation soared to a rate that peaked at about 9% in June 2022, the highest rate since the early 1980s.
Americans had grown accustomed to far lower levels of inflation, which averaged a bit below 3% in the 40 years prior to 2022.
As a consequence, donors may not have taken into account the fact that annual gifts simply did not go as far in 2022 as they did in 2021. If you gave your local food pantry $100 in 2021 and then did the same in 2022, you might think that your giving didn’t change. But in a year of high inflation rates, that seemingly steady donation was actually a smaller gift in terms of what the food pantry could do with the money.
Foundations and corporations also gave less than they did the year before, and bequests from the estates of people who have died also declined after adjusting for inflation.
Similarly, giving to nearly all of the nine categories that Giving USA tracks fell in 2022 in inflation-adjusted dollars.
One of the two exceptions was gifts to foundations, which grew 1.9%. This small uptick was probably caused by one or two large gifts to new or existing foundations.
We also saw some promising signs. For example, giving for international causes grew by 2.7%, likely driven by support for Ukraine following Russia’s attack. This is in keeping with another pattern in the data: Americans give charitably as a way to address pressing issues. In the Great Recession, Americans increased giving to support basic social services, such as gifts to food banks, even when overall giving declined.
Finally, it is important to acknowledge that giving did remain close to record levels in 2022, at nearly $500 billion for the year. As the report observes, giving eventually bounces back from declines, even when adjusting for inflation.![]()
Patrick Rooney, Glenn Family Chair Emeritus of Economics and Philanthropic Studies, Indiana University; Anna Pruitt, Associate Director of Research, Indiana University Lilly Family School of Philanthropy, and Managing Editor, Giving USA, Indiana University, and Jon Bergdoll, Associated Director of Data Partnerships at the Lilly Family School of Philanthropy, Indiana University
This article is republished from The Conversation under a Creative Commons license. Read the original article.
- Details
- Written by: Angela De Palma-Dow
Dear Lady of The Lake,
There is a weird smell coming from the lake at our lake house; it smells pretty bad. Is this something to be worried about? Was there a sewage spill?
Thanks,
From Worried about the Aroma, Eva.
Dear Eva,
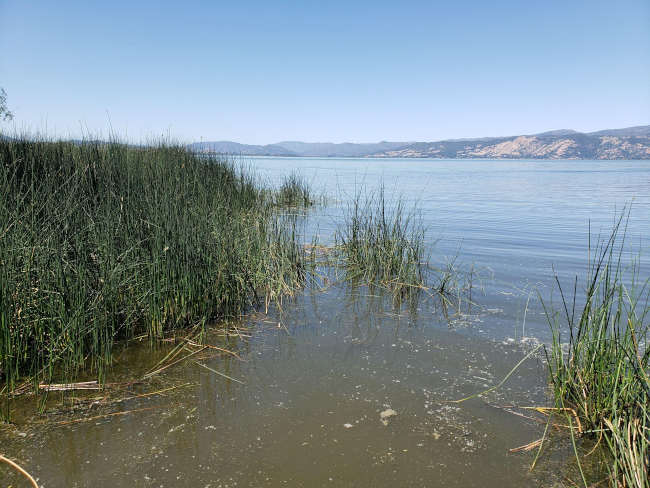
Thank you for this question! I have actually gotten asked this several times recently. Anyone who has been outside anytime this week in the vicinity of the lake, might have also observed a specific odor associated with large, fresh waterbodies.
For a lake nerd, like me, I am not ashamed to say I love that smell. It means the lake is very alive and life is thriving. However, in some areas of the lake the smell can become very concentrated, and with a certain wind direction and temperature combination the smell can become singularly strong and sometimes noxious.
Lake signs of life and death
This time of year, when the sunlight days are long and the temperature is - finally! -warm, this is when growth in the lake is at its highest rates. This basically means that organisms from the smallest phytoplankton cell, to large clonal tule beds, to the largest catfish or river otter are growing the most this time of the year.
That’s because the conditions are the best for metabolic processes like photosynthesis and respiration, decompositions, nitrification, and denitrification. These are all very long words for saying that plants and animals, big and small, are happy, healthy and growing the most right now because it's easy for chemical processes to occur when it's warm. Also, the consumption and excretion processes are also in full force right now.
The smallest organisms in the lake, that mostly contribute to smells and odors, are green algae (phytoplankton) and blue-green algae (cyanobacteria). Cyanobacteria are not related to algaes at all, they are bacterias, but they look similar to our naked eye as green algae so historically they have been labeled an algae, and a blue-green algae for the colors they sometimes appear as.
Phytoplankton are simple microscopic organisms, like small plants. Cyanobacteria are aquatic bacteria, much smaller than phytoplankton, and they inhabit the same space as phytoplankton. Because both phytoplankton and cyanobacteria photosynthesize, they take in sunlight, carbon dioxide, and use nutrients from the lake as fuel, it’s easy to see why they are abundantly growing this time of year.
Cyanobacteria are usually single-cellular and can form colonies and dense mats at the surface of the water due to buoyant chambers some genera produce. The buoyancy characteristics of cyanobacteria means they can make themselves float at the surface of the water, usually in dense colonies, which can shade out the phytoplankton below them.
Sitting at the surface of the water, baking in the sun, can also cause death to some of the colony, causing a very strong odor in the near vicinity. After the cells die, they fall through the water column and break apart, releasing the nutrients they consumed as fuel, and neighboring cyanobacteria cells are now able to utilize those nutrients, grow, reproduce, and float to the surface of the water to conduct the whole cycle again.
This cycle of cyanobacteria, growing, reproducing, dying, and recycling for new cyanobacteria, is the most probable cause of the strongest odors coming from the lake right now and going into the end of summer and early fall.
Other sources of lake smells can be the decay of aquatic plants that have washed up along the shore and are rotting in the sun. Aquatic plants can also get tangled up with insects and baby fish, so those organic tissues can add to the decay and odors along the shorelines or in shallow, very warm areas of the lake.
Green algae that can also boom and busts cycles within the lake, with excess growth and decay giving off similar odors as dead plants. If you would like to learn more about green algae, or phytoplankton, you can visit the the County of Lake Water Resources Department “Algae in Clear Lake” webpage.
If you want more information on cyanobacteria, beyond that related to smells, you can visit my previous Lady of the Lake column from July 11, 2021, “Concerned about Cyanobacteria in Soda Bay."
What about spills,blooms, sheens, and foams
The likelihood of this smell being sourced to a sewage spill is very small, as sewage spills into the lake actually don’t have much of a strong smell because of the dilution of the lake water, and there is quite a bit of lake water (46,000 acres in fact!).
Secondly, there hasn’t been any reported spills the last few weeks at all, and for years there have not been any spills directly into the lake that were large enough to cause a persistent smell like you described.
You can learn about, search for, and find any reported hazardous spills at the CalOES Hazardous Spill Reporting Database. You can do a filtered search by county, and year, or a specific date.
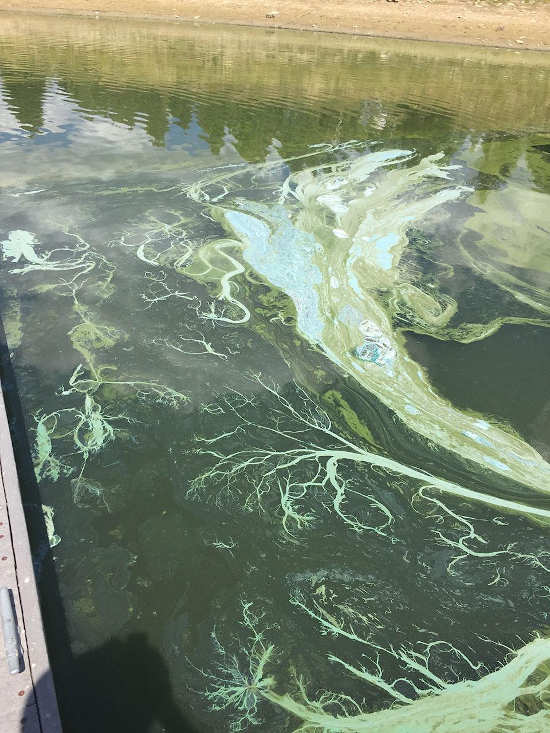
Sometimes smells are accompanied by blooms, mats, sheens, or foams. Blooms can look like bright green, blue, purple, even reddish water, and mats can look like thick, almost solid, clumps, or layers on the surface of the water. Both blooms and mats can be attributed to specific genera of cyanobacteria.
Sometimes the water looks so opaque and blue green that people mistake it for paint spills. I actually responded to a report of spilled paint this year that turned out to be a cyanobacteria bloom – it’s not unusual and when you see it, it really does look like paint.
Sheens can appear when any natural decompositional process is occurring, such as the dying and decay of plants, animals, insects, or algae cells. Sheens are caused by oils that are released from the organisms during the decomposition process, and since oils are lighter in density than water, they will sit at the surface of the water and look much similar to an “oil spill” or “gasoline spill.”
Rotting vegetation can also produce methane gasses, especially when it sinks to the muddy bottom of a lake or wetland. Microbes break down the decaying vegetation, which metabolically takes all the oxygen out of the system, and methane is a byproduct.
Methane can mostly just evaporate into the atmosphere, but when its concentrated in a small area, usually in a shoreline zone, trapped among some tules, or in a pool where water has receded, the methane molecules collect together, and appear as thick or rainbow sheens on the surface of the water. The hydrocarbons that make this methane phenomena are very similar in structure to the hydrocarbons in petroleum gasoline and oils used for engines, so that is why they are often confused with spills or illegal discharges.
Methane can become especially smelly when it is mixed with naturally occurring hydrogen sulfide, especially in environments that have high sulfates, which can include Lake County because there is high ambient sulfur background in the surrounding geology. This can mimic the smell of rotten eggs, and can be very obtrusive to some with acute senses of smell.
Need help identifying a bloom, mat, aquatic plants, or foam? Refer to this California Water Board HAB and Non-HAB visual guide.
Foams that accompany smells, or discolored water, are completely natural, although they get mistaken for pollution or discharge events. Foam is very natural for lakes and streams, and happens when there is an abundance of organic (i.e. carbon-based) materials in the water, which can break down surface tension of water making bubbles form. Physical lake processes, like wind or wave action, can concentrate bubbles into thick foams in a single area, or even a line parallel to a shoreline.
Sometimes the foams get mistaken for a “detergent spill” but detergents don’t last as long as natural foams since their sudsing agents are very short lived, and usually detergents have a pleasant, floral or perfume fragrance to them, which does not really correspond with reports of algae and lake smells.
Sometimes the foams occur out in the open water, and in combination with organismal processes, the lake appears to have lines or rows of green or brown or white foamy streaks. These are totally natural and way cool and called Langmuir Lines. You can learn all about these in my “Look, Look! It’s Langmuir Lines” column from March 2022.
Sometimes smells can arise from larger dead organisms, such as fish. Recent carp and goldfish die offs in the late, caused by a lab-determined koi herpes outbreak, is causing lots of large-bodies carp and goldfish to go belly-up and wash ashore near homes, parks, docks, and recreation areas on the lake.
Of course decaying tissue such as a fish would cause a particular strong odor, but will quickly dissipate naturally especially during windy and waving conditions. To speed up the process, should one be capable, a net and a trashcan will eliminate the odor completely. There is no public service that will collect and dispose of the dead carp in Clear Lake.
If you suspect there is a fish kill of a different species of fish, and in numbers that are unusual (more than a few) then you can report this to the California Department of Fish and Wildlife Mortality hotline, 916-358-2790, or submit a report to the online form.
For more information on Fish Kills, visit my column from August 2021 called “Figuring out Fish Kills.”
Much too smelly
I hope I answered your question Eva, and I wouldn’t worry about the aroma if I were you, it’s a sign that our lake is full of life.
However, if the smell becomes too strong, or noxious, and is impacting you, or someone in your family that has a history of respiratory problems, the State Of California Office of Environmental Health Hazard Assessment, or OEHHA, wants to know about it and has resources to respond. OEHHA can provide specialized guidance that is beyond the resources available at the local level.
To report a health impact from a bloom or cyanobacteria bloom, suspected bloom, from the lake, you can submit a report to OEHHA via the Harmful Algal Bloom Incident Reporting tool, called “Report a Bloom."
You can submit a report here online: https://mywaterquality.ca.gov/habs/do/bloomreport.html.
Or by calling their Report a Bloom hotline: 1-844-729-6466 (toll free).
It takes about a minute to fill it out, but it’s essential that the state receives this information so that they can respond and direct more adequate resources to cyanobacteria management and mitigation.
If you are interested in knowing where reports of blohttps://mywaterquality.ca.gov/habs/where/freshwater_events.htmloms are, so you can cross-reference with your location in help to identify a potential odor or condition in Clear Lake, or other lakes, you can visit the HAB Incident Reports Map.
In lakes, and other natural water bodies, like rivers, bogs, marshes, and wetlands, smells and odors are usually indicative of natural cycles of life and death. Aquatic ecosystems have a great way to effectively reusing and recycling materials, they just might get a little smelly along the way. Some odors can be pungent at times, but they are not permanent.
— Sincerely,
Lady of the Lake
Angela De Palma-Dow is a limnologist (limnology = study of fresh inland waters) who lives and works in Lake County. Born in Northern California, she has a Master of Science from Michigan State University. She is a Certified Lake Manager from the North American Lake Management Society, or NALMS, and she is the current president/chair of the California chapter of the Society for Freshwater Science. She can be reached at