 How to resolve AdBlock issue?
News
- Details
- Written by: LAKE COUNTY NEWS REPORTS
NORTHERN CALIFORNIA — The California Highway Patrol this week will graduate the latest cadet training class, which will provide new officers to CHP offices throughout the state.
The CHP said 142 members of Cadet Training Class I-21 participated in a five-mile run from the Academy in West Sacramento to the California Peace Officers’ Memorial early Wednesday morning.
This run is a ceremonial rite-of-passage for the cadets and signifies the end of their six-months of training, the CHP reported.
At the memorial, the CHP said the cadets honored the more than 1,600 law enforcement officers who came before them and made the ultimate sacrifice serving the people of California.
The CHP said it will swear in the new officers at a graduation ceremony at the CHP Academy on Friday.
Following the graduation ceremony, the new officers will serve in communities throughout the state.
Officer Efrain Cortez of the Clear Lake Area office said two of the new officers will be coming to Lake County and will start their training here.
- Details
- Written by: FRANCES CHEN AND KALEE BURNS
There were 37.3 million people in poverty in 2020, according to the official poverty measure. In contrast, there were 29.8 million people in poverty that same year, according to the Supplemental Poverty Measure.
While these measures may seem at odds with each other, they each present a different angle of poverty in the United States.
In recognition of National Poverty in America Awareness Month this month, the U.S. Census Bureau is highlighting two poverty measures it uses to capture a clearer picture of poverty and equity in the United States.
The first — the official poverty measure first published in the mid-1960s — is based on cash resources.
The second — the Supplemental Poverty Measure (SPM) — includes both cash and noncash benefits and subtracts necessary expenses (such as taxes and medical expenses).
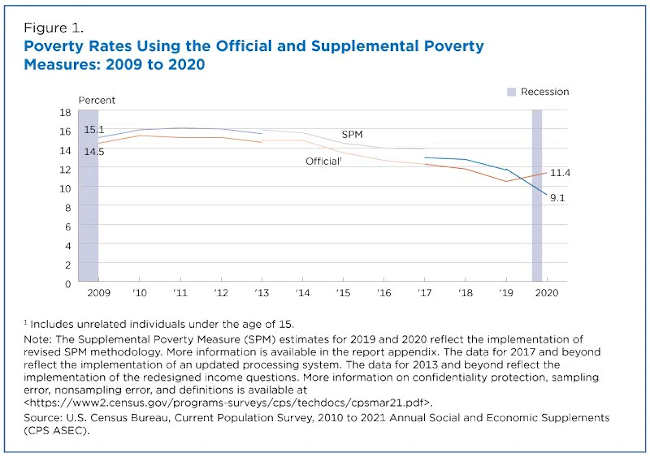
The 2020 SPM rate of 9.1%, the most recent available, was the lowest since the measure was first published in 2009, and the first time the SPM rate was lower than the official poverty rate.
Differences between poverty measures
The official poverty measure has remained mostly unchanged since the mid-1960s, but the SPM was designed to keep pace with changes in data, methods, and new research.
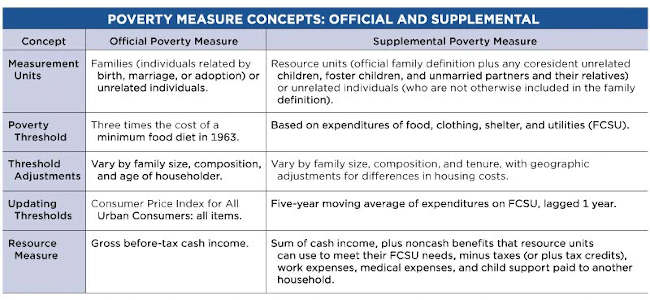
The table below shows a detailed comparison of major concepts between the two measures. (The history of poverty measures in the United States infographic, “How the U.S. Census Bureau Measures Poverty,” and this blog on the difference between SPM and official poverty measures provide more details.)
Official poverty measure
The official poverty measure compares an individual’s or family’s pretax cash income to a set of thresholds that vary by family size and the ages of family members.
These official poverty calculations do not account for the value of in-kind benefits such as nutritional assistance, housing and energy programs, or tax credits like the earned income tax credit or stimulus payments.
They also do not consider regional differences in living costs or expenses such as housing.
Supplemental poverty measure
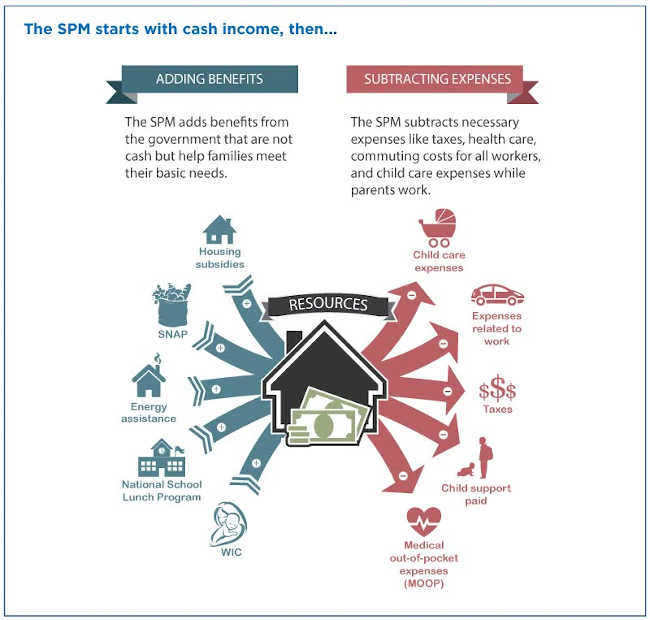
On the other hand, the SPM does consider family resources and expenses not included in the official measure as well as geographic variation.
First, it adds the value of refundable tax credits and in-kind benefits available to buy basic goods to cash income. In-kind benefits include nutritional assistance, subsidized housing, and home energy assistance.
Then, it subtracts necessary expenses for critical goods and services not included in the thresholds from resources.
Necessary expenses subtracted include income taxes, Social Security payroll taxes, child care and other work-related expenses, child support payments to another household and medical care and health insurance premium contributions.
The Bureau of Labor Statistics’ Division of Price and Index Number Research produces the SPM income thresholds based on Consumer Expenditure Survey data that show how much people spend on basic necessities (food, clothing, shelter and utilities) and are adjusted for geographic differences in housing costs.
The SPM thresholds are not intended to assess eligibility for government assistance.
Official vs. supplemental poverty rates
In September 2021, the Census Bureau released the 11th SPM report for 2020. The report presented estimates of both the official and Supplemental Poverty measures and outlined differences between the two.
From 2009 through 2019, the SPM ranged from 0.6 to 1.6 percentage points higher than the official measure (Figure 1).
In contrast, the 2020 SPM was 2.3 percentage points lower than the official measure. This was the first time in the history of the SPM that its poverty rate was lower than the official poverty rate. SPM rates in 2020, which included stimulus payments, were at their lowest level since the first-published SPM estimates.
A recent America Counts story, “Who Was Lifted Out of Poverty by Stimulus Payments?”, showed that without stimulus payments, the supplemental poverty rate would have increased by approximately 3.6 percentage points.
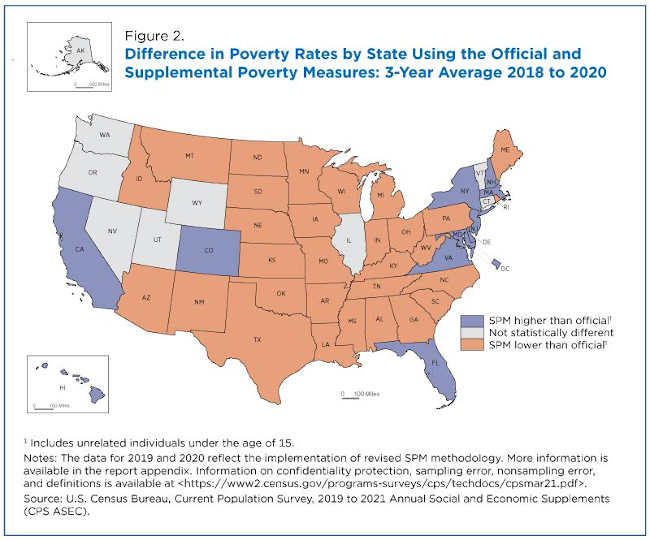
In 2020, SPM rates were:
• Higher than official poverty rates in 11 states plus the District of Columbia.
• Lower than official poverty rates in 30 states.
• Not statistically different in nine states.
Poverty across age groups
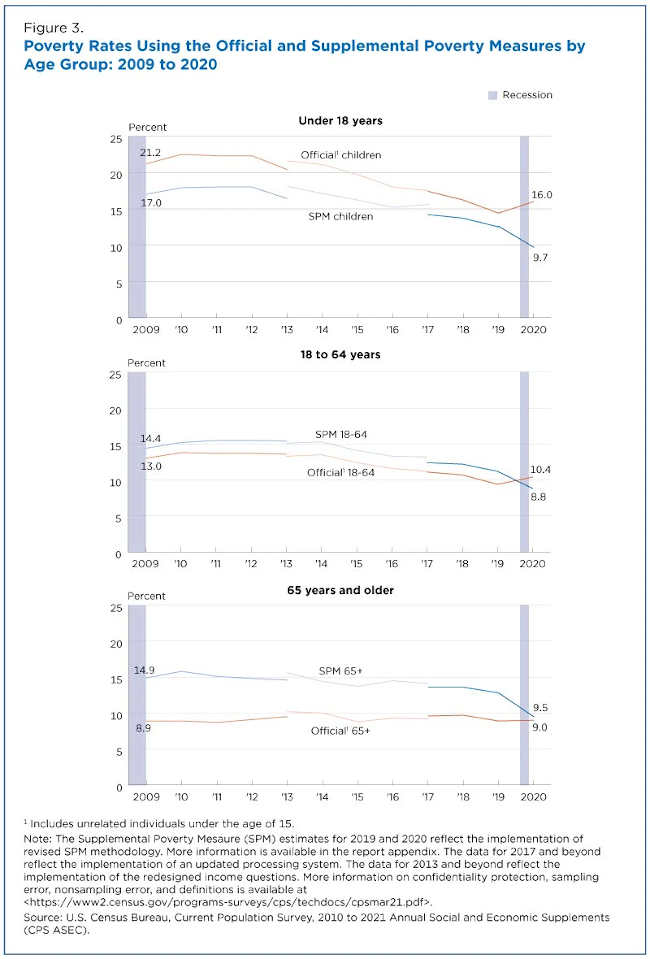
While the SPM rate for children declined between 2019 and 2020, the official poverty rate increased over the same period, widening the gap between the two measures from 1.8 percentage points in 2019 to 6.3 percentage points in 2020 (Figure 3).
SPM rates for individuals ages 18 to 64 were also lower than official poverty rates in 2020, for the first time in the history of the SPM.
The gap between the official and SPM rates for individuals 65 and older declined from 3.9 percentage points in 2019 to 0.5 percentage points in 2020. SPM rates for each major age group in 2020 were at their lowest level since 2009.
Estimates in this story were calculated using the SPM universe, which includes unrelated individuals under age 15.
More details on the impact of policies and programs on the SPM rate are available in the 2020 SPM Report. Additionally, more information on confidentiality protection, methodology, sampling and nonsampling error and definitions is available.
Frances Chen is a survey statistician in the Census Bureau’s Poverty Statistics Branch. Kalee Burns is an economist in the Census Bureau’s Poverty Statistics Branch.
- Details
- Written by: Andrew Moreo, Florida International University; Imran Rahman, Auburn University; Lisa Cain, Florida International University, and Trishna G. Mistry, University of South Florida

About 3.5 million people have at least temporarily left the U.S. workforce since March 2020. Over one-third of them – 1.2 million – are in the leisure and hospitality industry.
This has created huge problems for restaurants, hotels and other leisure and hospitality businesses that have struggled to find workers for record numbers of job openings in 2021.
A big part of this decline seems to be explained by the “great resignation.” Leisure and hospitality workers are quitting at the highest rates of any industry. About 1 million quit in November 2021 alone. And the data suggests many of them are not simply swapping one hospitality job for another but leaving the industry entirely.
Why are these workers quitting, where are they going and what can be done to bring them back?
We recently commissioned a survey aimed at tracking down some of these workers and answering these questions. The research is ongoing, but our early qualitative results offer some clues to answering these questions.
Reasons for attrition
Before we get to our early data, there are several characteristics of leisure and hospitality work that help explain why the industry has unusually high turnover rates.
For one thing, the wages are very low. Leisure and hospitality workers were earning an average of $515 a week – including tips – as of December 2021, making them the worst-paid of all sectors, according to Bureau of Labor Statistics data. That’s less than half of the average for all private workers and translates into annual income of under $27,000 – based on 52 weeks of pay.
This puts financial stress on these employees, often forcing them to work multiple jobs to get by.
The working hours are also challenging, often involving nights, weekends and holidays, which means hospitality workers routinely miss out on time with friends and family, limiting opportunities to recharge their emotional batteries.
Moreover, the nature of the jobs in this sector are particularly stressful and emotionally draining. In fact, sociologists and economists have a phrase for this: emotional labor. This concept refers to the suppression of whatever emotions an employee may be experiencing to provide good service to a customer – and often “with a smile.”
In hospitality, employees must regulate the outward expression of their emotions to the benefit of the customer and their employer, regardless of what they are feeling. Sometimes this puts little or no burden on the employee, but at other times it takes a great emotional toll.
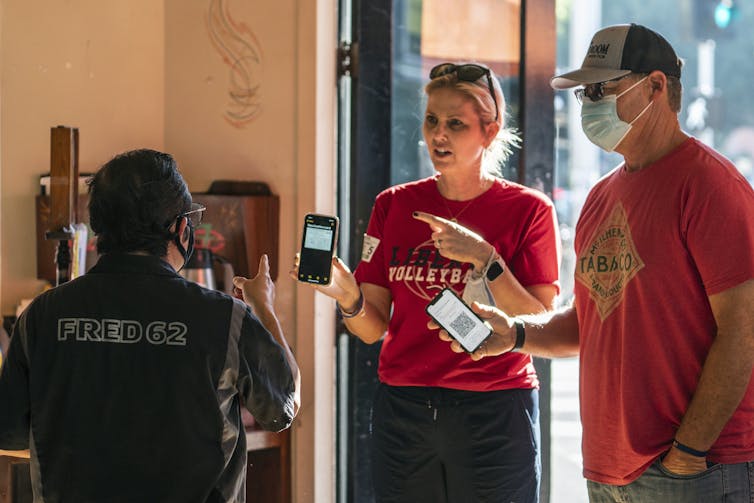
The COVID-19 pandemic has amped up the emotional labor of service work considerably.
The new stressors include massive furloughs and layoffs since March 2020, significant risks to personal health by having little choice but to work at a physical location where workers regularly are in close proximity to colleagues and customers, as well as fights with patrons over enforcing mask bans and vaccine mandates. The news media regularly report on angry and even violent confrontations between customers and service workers, whether on planes, in restaurants or in other types of establishments.
Finding the ‘quitters’
While there’s been a ton of coverage of the sector’s record quit rate of 6.4% in November – the latest data available – there’s less hard data on why hospitality workers are leaving their jobs now and where they are going.
So as part of an ongoing project studying employee attrition, we asked Qualtrics – an employee and customer experience data-gathering company – to find people who worked in the hospitality sector before and during the COVID-19 pandemic and have since left the industry – a process that was exceedingly difficult.
We completed a qualitative unpublished pilot study in December 2021 to help inform a larger quantitative survey we’re working on right now. Our initial results, which include open-ended responses from 31 people, aren’t necessarily representative of all or even most workers who have quit their jobs but allow us to paint a more complete picture of what’s driving the decisions of these specific individuals. We asked them why they left, where they went and what could lure them back to a hospitality job.
We used their answers to construct questions that are appropriate for in-depth statistical analysis, which will then be administered to 350 people who agree to take part in the quantitative survey. Results of that survey will be available in a couple months.
Why people are leaving
Our first question focused on what drove people to not only quit their jobs but leave the hospitality sector. The most common responses related to health and safety concerns, burnout and issues involving managers or co-workers.
One of our respondents was a 35-year-old single mother who said she had been working in the food service industry for about five years before the pandemic hit. She quit her job four months later.
“My safety and my family’s safety were on the line and I was being overworked,” she said.
A 20-year-old man said he left the hotel industry during the pandemic after five years “because I truly wasn’t happy” and “didn’t have the will to keep going on.”
Another 35-year-old woman said she quit her job on a cruise ship because she cares for her elderly parents, who would be more at risk were they exposed to COVID-19.
“They didn’t care about our well-being,” she said. “I have family at home that can die if exposed to COVID.”
Where did they go
As for what the people in our survey decided to do after leaving the industry, the most common answer was to get more education. But others emphasized a desire to go into business for themselves or to a different type of service job, such as in retail.
A 21-year-old man who had been working at nightclubs for over three years said he quit to go to college.
Both the 35-year-old single mother and 20-year-old man said they decided to become self-employed.
Another 23-year-old single mother who had worked in food service before and during the pandemic left for retail, stating: “I got another job as a cashier and it was the only thing I could find at that moment.”
Would they go back
Most of our participants told us nothing would bring them back to these types of jobs – they were done with the industry. The 35-year-old single mother, for example, said there was nothing that could be done to bring her back now that she had moved on with her own business.
But others said better money or hours would help lure them back, as well as stronger managerial support.
[Over 140,000 readers rely on The Conversation’s newsletters to understand the world. Sign up today.]
A 42-year-old woman who spent nearly a decade in the food service industry said she would return for “better pay and more respect,” a sentiment echoed by others.
An 18-year-old woman said she quit a food service job because of a manager with a “really bad temper” who would “cuss at customers and employees.” She said that the only way she would go back to hospitality work is if a company showed her “that managers are actually there to help employees.”
“I would also like customers to be more patient and humble,” she added.![]()
Andrew Moreo, Assistant Professor of Hospitality Management and Director of Research, Florida International University; Imran Rahman, Associate Professor of Consumer Behavior, Auburn University; Lisa Cain, Associate Professor of Hospitality Leadership and Marketing Management, Florida International University, and Trishna G. Mistry, Assistant Professor of Hospitality Management, University of South Florida
This article is republished from The Conversation under a Creative Commons license. Read the original article.
- Details
- Written by: Elizabeth Larson
Assistant City Manager Nick Walker asked for the council to consider a spending plan for Coronavirus State and Local Fiscal Recovery Funds and direct staff on next steps.
Walker said the city has been allocated funding totaling $1.2 million, and he presented a shortlist of four projects staff recommended because they fit into the funds’ most flexible category, revenue loss.
Those projects are South Main Street, from First Street to Lakeport Boulevard; renovations to the Silveira Community Center, which staff said still requires updates, in particular, Americans with Disabilities Act-compliant restrooms; the planned recreation center; and water and sewer projects pulled from the city’s current rate study.
Walker said it’s a great opportunity to significantly fund one of those otherwise unfunded large capital projects.
Councilwoman Mireya Turner said it was a really good list of priorities that have been on city leaders’ minds for years and asked about prioritizing them.
City Manager Kevin Ingram said staff could crunch the numbers and see how far the funds would get them on the various projects. “We can bring that back for further action.”
Councilman Kenny Parlet said he liked the idea of getting something done and seeing cost estimates from staff. “Things change from month to month, quarter to quarter.”
Councilman Michael Froio offered his priorities, placing the South Main Street work in the No. 1 spot, followed by water and sewer projects, the Silveira Center’s upgrades and the recreation center.
Councilman Michael Green said he wanted to narrow the list of projects to just two, with the Silveira Center and roads being his two priorities.
Mayor Stacey Mattina said the heating and air conditioning system and the kitchen had been upgraded at the Silveira Center and asked what was left.
Ingram said the ADA bathrooms were the single largest piece that needed to be finished on the center. Mattina asked if any other funds were lined up for that purpose, and Ingram said no.
Turner said it would be helpful to get the more detailed numbers from staff, explaining she wanted to see cost comparisons for each of the projects.
While she noted that she favored the roads, Turner said she wanted to finish the Silveira Center so it could be used by the community.
Ingram said staff would bring back those pricing estimates for the Silveira Center and for some of the water and sewer projects.
Mattina said it also would be good to look at other funding opportunities for the city’s projects.
Ingram said the city had a little time and could spend some effort in looking at the project costs.
Walker’s written report explained that the funds have to be obligated by Dec. 31, 2024.
The council voted unanimously to support staff bringing back more detailed spending estimates for the list of projects.
In other business, the council approved a letter of support for the Lake Area Planning Council work regarding a rural regional energy network and accepted the annual comprehensive financial report for fiscal year 2020-21.
Email Elizabeth Larson at