 How to resolve AdBlock issue?
News
- Details
- Written by: Angela De Palma-Dow
Dear Lady of the Lake,
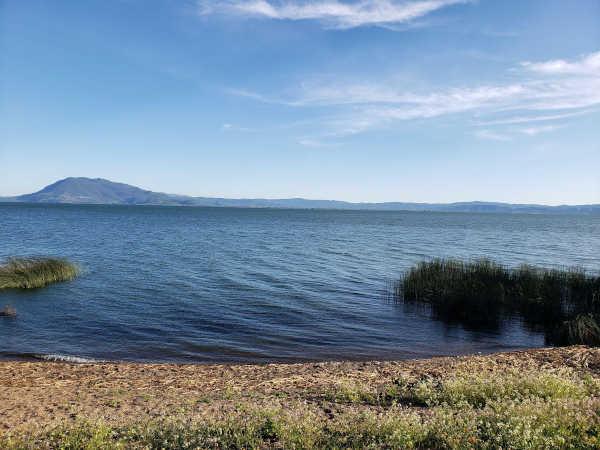
The lake water over by Lucerne to Glenhaven looks brown, is this a spill or leak from something? What’s going on with the lake right now?
Thanks!
- Water that’s brown has got me down Walter
Hello Walter,
Thanks for the question! This is a common observation this time of year, and I am glad you provided the opportunity for me to discuss this in my column.
The first question to ask when trying to “diagnose” a lake situation, when it comes to water issues, is to identify the scope and size of the specific situation. In this case, the area you describe is pretty large - according to my trusty Google My Maps measuring feature, the open water area along the shoreline between Glenhaven and Lucerne is about seven (7) miles. That is really a long distance and includes a large expanse of water. The area around the Narrows is fast moving water, as the current from the Upper Arm into the Lower and Oaks Arm is quite significant, even on non-windy days.
Based on the size of the area and the type of water movement, I would immediately eliminate the possibility of there being a spill or leak in the area causing this brown coloration. The area impacted is just too vast for any type of spill or leak. I also checked with the California Governor’s office of Emergency Services (Cal OES) online HazMat Spill Release Reporting Database <https://w3.calema.ca.gov/operational/malhaz.nsf/$defaultview> , and there have not been any reports of spills or leaks in that area and of that magnitude.
In addition, spills in areas with rough water or water with current tend to dilute and break up quickly over time. So if you are observing continuous brown coloration between the Upper Arm and through the Narrows to Glenhaven, then this most definitely is not a spill, but something within the water column itself.
Back to the Beautiful Basics: Colors of Light and Lakes
There are several possibilities that influence the color of lake water. Before we dive into what causes the browning of water or the lake, we need to remember the basics about how we see colors and what physical processes in water determine the colors that we can see.
Think about a time in winter or spring, when you have looked at Clear Lake from a hill or mountain. When looking at the lake from afar, the water color we see is what is most of the time the color light wavelengths that are scattered back, or refracted, from penetrating the water column.
According to the WebExhibits interactive Museum of Science, Humanities, and Culture, Causes of Color Series: "Visible light is merely a small part of the full electromagnetic spectrum… humans can detect the range of light spectrum from about 400 nanometers (violet) to about 700 nanometers (red). Humans perceive this range of light wavelengths as a smoothly varying rainbow of colors, otherwise known as the visual spectrum.”
This means that blue and green wavelengths are shorter than red, yellow and orange wavelengths. The longer wavelengths (lower energy) are being absorbed in the water column, and the shorter wavelengths (higher energy) are scattering or refracting back. Hence, when we look at deep, clear water lakes, such as Lake Tahoe, we see those lakes as very vibrant blue, because all the other colors are being absorbed except for the blues.
When we look at a blue lake, if we went down to the shore, and scooped up a cup of that lake water, it would appear very clear, and not blue at all. That’s important to note, because the depth of a lake can influence the blue color we see too. Deeper lakes can appear a darker blue, more frequently, while shallower lakes, while still appearing blue, are more bright blue more often then darker blue or other colors. The deeper the lake, the longer the space available for red, yellow, and orange wavelengths to become absorbed and for the blues to reflect, refract, and scatter back to be visible by our eyes.
Some very shallow lakes, or portions of lakes, like the Upper Arm in Clear Lake, do appear blue on occasion, usually when the lake is in its most clear water state, such as winter and early spring. Some times during the year, materials in the water can cause the blue light to become absorbed and other colors to reflect.
Browning lakes
Materials in the water column can influence the color of a lake. There are several scenarios where this is the case, but for today we are going to focus on the scenarios that will cause a lake or lake water to look brown.
Note that this discussion will focus on Clear Lake specifically, and may not apply to other lakes. For example, lakes in the Northeastern US are going through a “browning” phase, which visually looks alarming, especially to those who grew up with blue, clear lakes in the Northeast, the browning is actually a sign of potential lake recovery since the reduction of acidic rain deposition between 1990 and the 2020s.
The passage of the 1990 Clean Air Act, which mandated reductions in nitrogen and sulfur containing compounds from industry, and increase of precipitation in a heavily forested region, is responsible for helping lakes in the Northeast regain their brownness. It’s a fascinating story, one which you can learn more here in this publicly accessible special Issue from the North American Lake Management Society Magazine, Lake Line “Lake Management in a Browning World: Beyond the Holy Grail of Nutrients” by C.E. Williamson (2020).
Particles in the water column
Okay, well back to our neck of the woods: Clear Lake! Walter had mentioned that areas off shore of Lucerne down to the narrows, looked brown. This observation occurred recently, within the month of February. For this time of year, there can be several explanations.
First, the brown water could be literally just stirred up brown sediments or clay floating around in the water column. These materials can be either dissolved (less than 22 micrometers in size) or particulate particles (greater than 22 micrometers and easily able to be filtered out) in the water column.
The Upper Arm of Clear Lake is relatively shallow; when the lake is at the high water mark, or 7 ft Rumsey, the deepest point of the Upper Arm is roughly between 7-8 meters or 22-26 feet deep. But the majority of the Upper Arm is much shallower than this, meaning that a large wind event that last several days can easily stir up the mud, muck, and silt on the bottom of the lake and mix it into the water column, which when dissolved, can take several days to weeks to filter out and settle to the bottom.
We all know that January through April can bring some very windy conditions out on the lake, with white caps and waves dashing any relaxing ideas of paddle boarding, canoeing, or kayaking. Just imaging the impact of that wave energy on the loose sediment layer laying at the bottom of the lake, it’s easy to see how the brown water can just be remnants of sediment and water mixing from windy conditions.
Back to light wavelengths. Particles in the water column can both absorb and reflect different light wavelengths. Sometimes there is so much material in the water column that light is being absorbed immediately and can’t penetrate through the water column, meaning that none of the blue light can be reflected or scattered back, since it too, is being absorbed.
Carbon sources in lakes
Second, the brown water we see in parts of the Lake can be reflections of carbon materials in the water column. Carbon is the building block of everything living, our bodies are made of carbon through the food we eat, trees and plants take in CO2 from the atmosphere and convert the carbon gas into carbon structure, and organisms in the lake use carbon for similar purposes. Sources of carbon found in a lake can come from two sources, external or internal. External sources of carbon can be anything that is carbon-based that flows or falls into the lake from the terrestrial landscape.
Leaves falling off a tree into a river that flows down into the lake is a perfect example of an external source of carbon. The leaves are broken down into smaller carbon building blocks, first in the river then once they flow downstream, in the lake. The leaves also contain lots of other nutrients such as nitrogen.
Internal sources of carbon include those that are already located within the lake, such as algae, dead aquatic critters, and aquatic plants, to name a few. Submersed aquatic plants are ones that grow entirely under the water surface. They use carbon to create their growing, branching structure, then in the fall and winter when they die and decompose, the carbon is released back into the water column and sediments.
Like sediments and clays, carbon can be particulate and dissolved. Dissolved carbon can influence lake water color. For example, externally sourced carbon, from heavy non-deciduous forested areas, can be brown or red in color. You might have heard of this coloration called tannins. It’s similar to tea, with the tea leaves or tea bags being the external carbon source (like leaves or pine needles) that is leaching dissolved carbon into the water and changing the color to brown or reddish.
In lakes with high dissolved organic carbon matter, they can appear brown or almost reddish. This is because the dissolved particles in the water column are really good at absorbing the shorter blue and green wavelengths and not as good at absorbing the longer red wavelengths. So these high tannin and carbon lakes can look red, brown, or even sometimes black, since the colors being scattered back to our eyes are at the low energy red end of the light spectrum.
Generally, areas covered in coniferous trees (pines, redwoods, firs, cedars etc.) will have lakes or streams with more tannins and more dark brown/red waters. Areas surrounded by agriculture or deciduous trees (oaks and madrones) will tend to have less tannins and less brown waters.
Now in general, there is not enough forested area in the Clear Lake watershed to turn all of clear lake brown, and especially this year there was not enough precipitation to wash all the downed coniferous tree materials into the lake. In years when there is enough precipitation to have large runoff events, there is lots of precipitation from non-coniferous areas, so it balances out that in general, tannins are not a huge coloration factor on Clear Lake water color.
Diatoms
Third, watercolor can be influenced by the very small phytoplankton (green algae) and cyanobacteria that grow in the lake and feed off the carbon and nutrients provided by the internal and external sources of nutrients like nitrogen and phosphorus. Some of these phytoplankton are more dominant and abundant at certain times of the year, and recognizing patterns in these seasonal dynamics can help us determine what we are seeing out in the water, particularly if it’s brown in color.
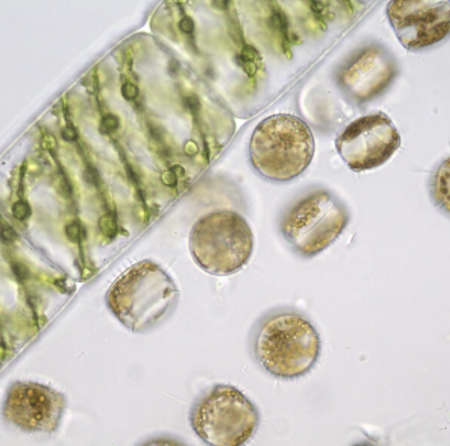
Winter and early spring, lakes usually see increases in populations of diatoms. Diatoms are probably some of the coolest and unique types of phytoplankton, or algae, found in freshwaters across the world.
According to the amazing reference online of Diatoms of North America (diatoms.org) diatoms “are algae that live in houses made of glass. They are the only organism on the planet with cell walls composed of transparent, opaline silica. Diatom cell walls are ornamented by intricate and striking patterns of silica.” Diatoms are very unique, but they have evolved to coincide in lakes with increased green algae and cyanobacteria bloom periods in the warmer periods of spring and summer.
Diatoms tend to be the most abundant in north american freshwater lakes in late fall through winter and into early spring, when the water is still relatively cold and there is limited sunshine. This time of year the growth of green algae and cyanobacteria is relatively low, and the lake water is relatively clear, leaving the diatoms the most ideal conditions to take advantage of the available sunlight and reproduce in abundance.
Diatoms, due to their glass structure, are prone to sinking and do well in times of water turbulence from wind events and lake mixing. As we discussed earlier, Clear Lake in the winter and spring is prone to mixing from wind events during the early parts of the year, so in addition to seeing brown sediments in the water in February, you might also be spying some diatom blooms.
The seasonal dynamics of diatoms, green algae and cyanobacteria is worth considering as climate change and a warming planet continue to disrupt “normal” temperature and storm cycles, in Clear Lake and other freshwaters across the globe. As the summer season expands, allowing longer periods of warm weather to dominate, the suitable range for diatoms will grow shorter, and it’s unclear if they can co-evolve fast enough to meet the challenge.
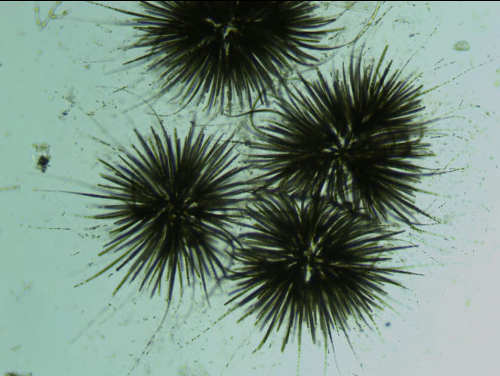
Some cyanobacteria can be brown too
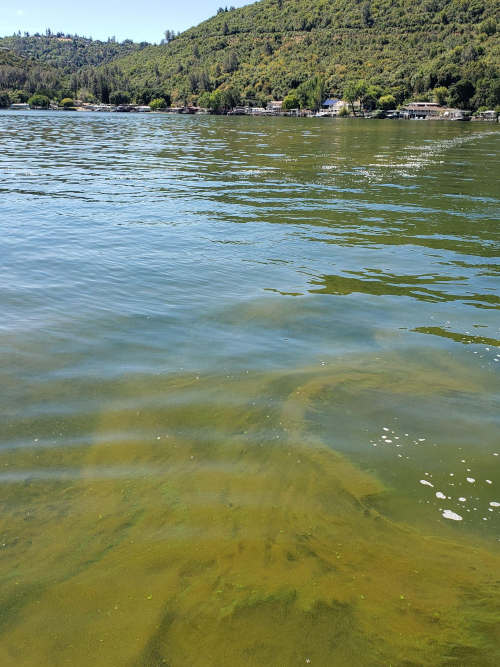
Lastly, blooms of the cyanobacteria Gloeotrichia can cause brown looking water when blooming in the lake. However, Gloeotrichia can also be shades of green, but unlike some of the other cyanobacterias, more strains of Gloeotrichia have brownish hues. If you have been out on the lake over the last two summers (2020-2021) gloeotrichia has been responsible for making some large brown stripes throughout the center of the Upper Arm and Lower Arm in summer and fall.
The brown water observed this last February (2022) could very well have been a bloom of Gloeotrichia, especially since recently we have had some spring-like warm weather, but it’s more likely to see these brown bloom events in the warm and sunny summertime in Clear Lake.
Gloeotrichia, although a cyanobacteria, has so far in Clear Lake not been observed to produce toxins like Microcystis, the most common toxin-producing genus of cyanobacteria in Clear Lake. That doesn’t mean that it won’t sometimes in the future, but until now that has not been observed and it’s only offense has been the occasional brown bloom in the middle of the lake during prime water-skiing weather.
Both diatoms and gloeotrichia are still considered particles that float in the water, and they absorb blues and green light wavelengths and reflect red and orange wavelengths, that’s why when you see these particles floating around in the lake they appear brown and when they are very abundance, large areas of water can appear very brown and almost reddish at times.
So why is the water brown now?
In summary Walter, based on the large expanse of brown water, given the time of year and the weather conditions we have been experiencing, my best guess as a lake biologist is that you are witnessing some sediment material turbidity from the recent wind events. To further substantiate my claim, I would argue that when we do get winds, they tend to normally (although, not always, I admit) come from the North or North West and blow east, towards the shores of Lucerne and the Narrows.
Further, this leads me to believe that during these westerly winds, the lake sediments and silts on the bottom of the shallow Upper Arm were stirred up, pushed towards that part of the lake, and the dissolved particles contained within that moved water, were floating around in the water column on the eastern shores of the lake.
I would also not be surprised that if we took some samples of water from those locations, and looked under the microscope at some slides, we might find the water rich and abundant with diatoms, which can greatly contribute some brown hues to the water. January and February are indeed diatoms' preferred time of year and they like being suspended in water that has been stirred up by wind and waves.
However, as the growing season marches along and the air and water temperature increases and the sunlight periods lengthen, if you are still seeing brown water, my diagnosis will of course, change. As many things in life, lakes are always variable and hardly consistent, but they are always consistently variable.
Sincerely,
Lady of the Lake
In addition to those linked within the article, some valuable resources used in this column include:
Spaulding et al. 2022. Diatoms.org: supporting taxonomists, connecting communities. Diatom Research. doi:10.1080/0269249X.2021.2006790
Lake Champlain Committee Color of Water Available at: https://www.lakechamplaincommittee.org/learn/lake-look/color
Angela De Palma-Dow is a limnologist (limnology = study of fresh inland waters) who lives and works in Lake County. Born in Northern California, she has a Master of Science from Michigan State University. She is a Certified Lake Manager from the North American Lake Management Society, or NALMS, and she is the current president/chair of the California chapter of the Society for Freshwater Science. She can be reached at
- Details
- Written by: Edward Lempinen
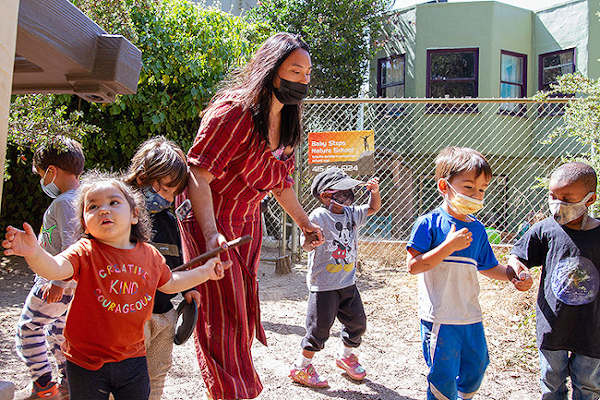
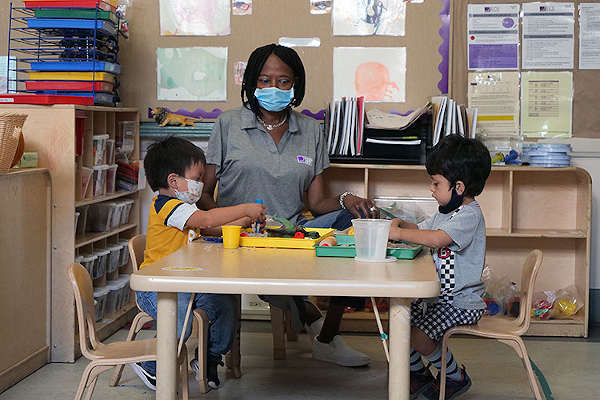
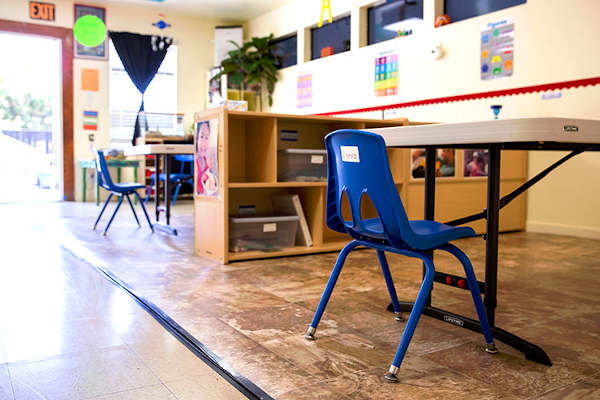
BERKELEY — California’s child care providers and teachers are earning such low wages that many need government assistance to make ends meet, and conditions are so dire that “radical reform” is needed to support them and to stabilize the entire child care system, says a new UC Berkeley study.
Among nearly 8,000 child care staff surveyed in 2020, median wages are below or near federal poverty levels, says the report from Berkeley’s Center for the Study of Child Care Employment (CCSCE). About a third reported that they are enrolled in Medi-Cal or other forms of public assistance, and a like percentage reported basic food insecurity.
The new study found that early educators — mostly women of color and immigrant women — struggle in “a grim financial bind” because of California’s low public investment in the child care system.
This financial stress has been compounded by the COVID-19 pandemic, which has made the low wages educators depend on even more unreliable. The stress is reflected in a shortage of child care services for working families, and that creates risks for the California economy, said CSCCE Director Lea Austin. There are at least 1 million children on the waiting list for subsidized child care.
“We need long-term solutions to ensure early educators’ economic well-being,” Austin said in an interview. “Without that, parents are going to keep having trouble finding the quality child care they need.”
“The economy can’t work without child care,” Austin added. “And child care can’t work without teachers.”
One early childhood educator quoted in the report is an immigrant with a bachelor’s degree from her home country in Asia and extensive training in early childhood education. But even after five years working at a center in California, she still earns only $15 per hour — a little more than $30,000 a year, before taxes.
“This profession surely requires education to give better quality care, but it seems like it is not being respected enough, in terms of salary,” she told the Berkeley researchers. “Even if I work full time, 40 hours a week, my annual salary is still below poverty level.”
"‘The Forgotten Ones’ — The Economic Well-Being of Early Educators During COVID-19” is based on the largest study in 15 years of California child care business owners and teachers. It offers troubling insight into conditions that affect nearly 140,000 child care providers, teachers and administrators working at California’s child care centers and care programs based in family homes.
The new report was researched and written by Austin; CSCCE analysts Anna Powell, Elena Montoya, Yoonjeon Kim and Abby Copeman Petig; and consultant Raúl Chávez.
It underscores the dire conclusions that emerged nearly two years ago in a separate CSCCE report on how COVID-19 had forced hundreds of California child care centers to close and put countless others at risk.
A child care system based on poverty-level wages
Today’s crisis dates back decades, but according to the new report, one condition has been constant: California’s child care system “relies on paying poverty and near-poverty-level wages.”
The impact on child care workers — and on child care homes and centers — is stark.
• The median wage for a California child care worker in 2019 was $13.43 per hour, while preschool teachers earned $16.83 per hour. By comparison, however, a kindergarten teacher earned $41.86 per hour — and even that was just above the California living wage for a single parent with one child.
• In the first year of the pandemic, more than 40% of family child care providers and nearly a third of center-based teachers were enrolled in public assistance programs, such as Medi-Cal or food support.
• Roughly one-third of early childhood teachers experienced food insecurity, with either not enough food to eat, or not enough quality or nutritional food. For women of color, the prevalence of food insecurity rose to 39%, and to 42% for immigrant educators.
• Almost one in three family child care providers in the early months of the pandemic were behind on rent or mortgage payments for the homes where they provide care.
The pandemic dramatically compounded the stresses on early care and education professionals in other ways, too, the report found. Some providers shut down their operations, temporarily or permanently. Workers were laid off and furloughed. Forty percent of family care providers and a third of center teachers in the state applied for unemployment after the pandemic hit in 2020.
As staffs were reduced, some educators had to put in longer hours. Meanwhile, 43% of those who operate child care centers from their homes said they were unable to pay themselves salaries for periods in 2020.
Black educators were far more likely to experience such negative business consequences, the report found.
“It's no wonder that programs are understaffed, and many have closed, which means families can't find the child care they need,” Austin said. “There was already a shortage before the pandemic, and the people who remain are under incredible financial, emotional and physical stress.”
The importance of long-term public funding for child care
According to the study, however, centers with federal Head Start or California State Preschool funding were more sheltered from COVID’s negative impact. Policymakers in Washington, D.C., and Sacramento implemented measures to shield the centers from dramatic income loss. And, the researchers found, 90% of administrators and staff at those centers had no problem paying the program’s rent or themselves and did not have to take on debt to cover costs.
That, the authors said, points to the “radical reforms” that could address economic disparities between different types of providers and between those who do and do not have public funding.
One priority for policymakers, they wrote, should be to establish contract-based models with state and federal funding for both centers and home-based providers. This is similar to how Head Start and state preschool funds are currently distributed.
They urged policymakers to set a minimum wage for California’s early educators, based on regional costs of living and by taking into account workers’ education and experience. An ideal target would be parity with kindergarten and elementary school teachers, they said. The CSCCE has found that among the state’s early childhood educators, the majority have college degrees.
Policymakers should also develop solutions to end inequality that harms women of color and immigrants in the early child care and education field.
Without such solutions, the Berkeley report warned, the pandemic’s damage to California’s child care system could be permanent. Some care facilities that closed during the pandemic may never reopen, and younger child care professionals may leave the field for work that pays a living wage.
“We can’t fault people for leaving for jobs with better pay and health insurance and not coming back to child care,” Austin said. “We can’t get to good, stable child care if we can’t stabilize and support the early care and education workforce. Until we intervene with public resources, the problem will not go away.”
With hopes cautiously rising that the pandemic will ease, “I just want to work and recover my life, little by little,” said one care provider who was interviewed for the report. “If there were support for us providers, even loans, so I could pay the mortgage and keep my house, that would be great.
“I don’t want to have to close and look for another job, because I really like working with children.”
Edward Lempinen writes for the UC Berkeley News Center.
- Details
- Written by: Elizabeth Larson
Dogs available for adoption this week include mixes of Anatolian shepherd, Australian cattle dog, basset hound, German shepherd, Great Pyrenees, Rhodesian ridgeback, Shar-Pei, shepherd, pit bull and Weimaraner.
Dogs that are adopted from Lake County Animal Care and Control are either neutered or spayed, microchipped and, if old enough, given a rabies shot and county license before being released to their new owner. License fees do not apply to residents of the cities of Lakeport or Clearlake.
The following dogs at the Lake County Animal Care and Control shelter have been cleared for adoption (additional dogs on the animal control website not listed are still “on hold”).
Call Lake County Animal Care and Control at 707-263-0278 or visit the shelter online for information on visiting or adopting.

Male Weimaraner
This 2-year-old male Weimaraner has a short gray coat.
He is in kennel No. 3, ID No. LCAC-A-2701.

Female German shepherd
This female German shepherd has a short black and tan coat.
She is in kennel No. 4, ID No. LCAC-A-2598.

Female shepherd mix
This 5-year-old female shepherd mix has a tricolor coat.
She was in kennel No. 9, ID No. LCAC-A-2793.

Female shepherd mix
This 7-year-old female shepherd mix has a tricolor coat.
She was in kennel No. 10, ID No. LCAC-A-2792.

‘Ruby’
“Ruby” is a 2-year-old female Shar-Pei-Rhodesian ridgeback mix with a short tan coat.
She is in kennel No. 13, ID No. LCAC-A-2560.

Male pit bull
This 2-year-old male pit bull has a short black and white coat.
He is in kennel No. 14, ID No. LCAC-A-2473.

‘Copper’
“Copper” is a young male basset hound with a red and white coat.
He is in kennel No. 16, ID No. LCAC-A-2817.

Anatolian shepherd mix
This 2-year-old female Anatolian shepherd mix has a short tan coat with black markings.
She is in kennel No. 23, ID No. LCAC-A-2535.

Anatolian shepherd-Great Pyrenees
This 2-year-old male Anatolian shepherd-Great Pyrenees has a short white coat.
He is in kennel No. 26, ID No. LCAC-A-2536.

Australian cattle dog
This 1-year-old male Australian cattle dog has a short blue and black coat.
He is in kennel No. 28, ID No. LCAC-A-2754.

‘Ginger’
“Ginger” is a 1-year-old female shepherd-Australian cattle dog mix with a cream and white coat.
She is in kennel No. 33, ID No. LCAC-A-2534.
Email Elizabeth Larson at
- Details
- Written by: Roberto Molar Candanosa
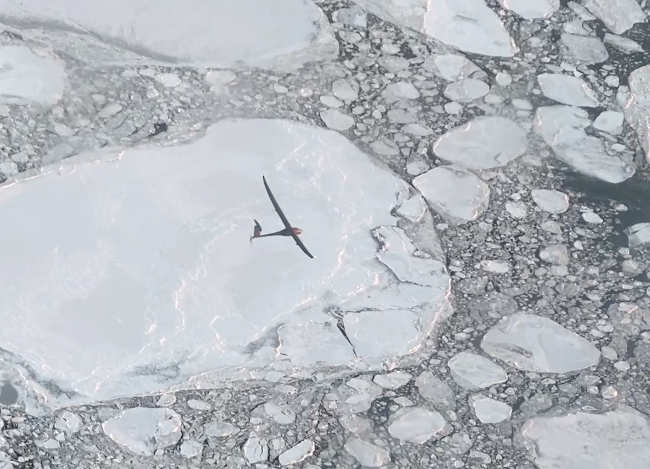
They’ve delivered groceries and performed light shows at the Olympics. But in the unforgiving Arctic climate, drones have struggled to fly for extended periods of time — the kind that would allow researchers to fly scientific instruments safely to keep tabs on the region.
Now, a team led by NASA scientists is showing how a fixed-winged drone named Vanilla could fly for several days over the Arctic ocean carrying an instrument that uses radar to measure the depth of snow accumulating on top of sea ice.
By testing the drone and snow radar instrument together, the team wants to provide key data to more accurately track and project how Earth’s polar regions are changing and influencing sea level.
Because snowfall puts an additional layer of snow over sea ice, even some of NASA’s most powerful altimeter systems in space struggle to measure the thickness of the ice. Data from drones flying at low altitudes can help scientists measure this changing thickness more accurately as Arctic sea ice waxes and wanes with the seasons.
“The same technique could eventually be used to assess how freshwater melting from Greenland and Antarctica contributes to sea level rise,” says Brooke Medley, a research scientist at NASA’s Goddard Space Flight Center in Greenbelt, Maryland, who leads the project.
In other words, Medley sees in drones, a path toward increasingly accurate projections of how sea level rise might reshape coastlines worldwide, and, for more temperate climates, a promising new tool to monitor wildfires, algal blooms, and other vital signals of change on Earth.
In November 2021, Vanilla flew for six hours over open ocean and sea ice more than 130 miles (222 km) from an airport in Deadhorse, Alaska, where a pilot controlled the aircraft and a scientist controlled the radar instrument.
By flying in more temperate weather for eight days straight in 2021, Vanilla earned the world record for continuous flight without refueling by a remotely piloted aircraft with internal combustion engine. In Alaska, unusual precipitation prevented multi-day flights, but early assessments show Vanilla could fly for nearly five days over Arctic sea ice.
To earn its “Arctic wings,” Vanilla flew with ice-detecting sensors, heating systems, and a special anti-icing coating to protect against fog and moisture that can quickly ice on its wings and propeller. The aircraft also runs on a diesel engine, which helps to regulate heat unlike battery-operated drones.
“Drones have come a long way, enough that they can start to be more than just quadcopters flying locally and looking at your neighborhood,” Medley says. “Flying drones is ultimately more green and safer than flying large planes, so this checks a lot of boxes.”
Medley, who leads the project, wants to survey sea ice in the Arctic and Southern Ocean with the drone. Ultimately, the idea is to fly over Greenland and Antarctica, Earth’s two ice sheets. Unlike expensive and labor-intensive airborne campaigns that rely on airplanes and crew, multiple drones could fly simultaneously, on a regular basis, and in multi-day surveys of an entire ice sheet, Medley says.
NASA satellites have played a key role in detecting how ice sheets have lost mass in recent decades. But they have struggled to measure fine details about how variations in snow depth on the surface of the ice affect the thickness of these continental glaciers.
Scientists typically determine the health of an ice sheet by measuring changes in surface height that help assess whether the ice is thinning or thickening. But snow blows constantly all around an ice sheet and piles on its surface over several years like a multilayer cake that satellites struggle to track.
“We have to make sure the thickness changes we're seeing aren't just a single snowfall event or the lack of a single snowfall event,” Medley says. “Then we can better interpret the changes that we're seeing from space if we know how much snow is falling.”
Because sea ice is already floating on the ocean, sea level does not rise significantly when that ice melts. But snowfall that settles on the ice sheets eventually melts and deposits freshwater into the ocean. Stored as frozen water on the surface of an ice sheet, this snow can also stall an ice sheet’s contribution to sea level rise, Medley said.
How exactly that accumulated snow influences sea levels is a poorly understood processes in studies of sea level rise.
“We need to monitor this snow accumulation,” Medley said, “because small changes can actually end up playing a very large role in sea level change.”
Roberto Molar Candanosa works for NASA’s Goddard Space Flight Center in Greenbelt, Maryland.