 How to resolve AdBlock issue?
News
The council will meet at 6 p.m. Tuesday, Jan. 4, in the council chambers at Lakeport City Hall, 225 Park St.
The agenda can be found here.
The council chambers will be open to the public for the meeting. In accordance with updated guidelines from the state of California and revised Cal OSHA Emergency Temporary Standards, persons who are not fully vaccinated for COVID-19 are required to wear a face covering at this meeting.
If you cannot attend in person, and would like to speak on an agenda item, you can access the Zoom meeting remotely at this link or join by phone by calling toll-free 669-900-9128 or 346-248-7799.
The webinar ID is 973 6820 1787, access code is 477973; the audio pin will be shown after joining the webinar. Those phoning in without using the web link will be in “listen mode” only and will not be able to participate or comment.
Comments can be submitted by email to
On Tuesday, City Manager Kevin Ingram will ask the council for the go-ahead to negotiate a 30-year lease agreement with Westside Community Park for the use of a 7.5-acre site on City of Lakeport Municipal Sewer District property for the new horse park site, contingent on the receipt of a $3 million Proposition 68 grant the park’s committee is seeking.
The portion of the CLMSD property in question, which is vacant, is located on Highway 175 near Mathews Road.
The horse park has been in the planning stages for several years, but in the fall Westside Park Committee Chair Dennis Rollins presented to the council the proposed plan for the horse park and trail area, which was the result of extensive community outreach.
In other business, the council will hold a public hearing regarding compliance with SB 1383. Council members will consider an ordinance adding to the city code language regarding the recycling of construction and demolition debris and introducing an ordinance related to water efficient landscape and set a second reading for Jan. 18.
Community Development Director Jenni Byers will take to the council a discussion about outdoor dining in the public right of way as part of the current COVID-19 emergency temporary use zoning permits and ask for direction on how to move forward.
Her written report notes that, for several years, “Lakeport staff had been discussing appropriate methods to incorporate parklets into the downtown area. A parklet is an innovative way to add temporary gathering spaces to public streets. Built and maintained by neighboring businesses, parklets are frequently located in the parking lane adjacent to the curb and designed as an extension to the sidewalk.”
Options before the council include directing staff to leave the temporary permits in place until permanent standards can be defined and implemented; directing staff to work with the existing permits to remove the makeshift sidewalls so that the streetscape is visible, leaving only the awnings; revoking the temporary permits until permanent standards are approved or if there is another hard closure of indoor spaces; or providing another direction to staff.
Also on Tuesday, Utilities Superintendent Paul Harris will present to the council a bid from Leete Generators for the purchase of three generators in the amount of $186,994.54. He’ll also ask the council to award a construction contract to the low bidder for installation, for a total project cost not to exceed $258,468.30.
Harris said the generators are for the city’s water treatment facilities.
Other items on the agenda including Mayor Stacey Mattina’s appointments of council members as liaisons to various boards, committees and commissions; adoption of a resolution appointing representatives to represent and vote on behalf of the City at the League of California Cities, Redwood Empire Division Business meetings and represent the city and vote at Division Legislative Committee meetings; receiving and filing the communications strategic plan; and adopting a resolution adding a 12th member of the Lakeport Economic Advisory Committee to be assigned to Sutter Lakeside Hospital.
On the consent agenda — items usually accepted as a slate on one vote — are ordinances; minutes of the council’s regular meeting on Dec. 7 and special meeting on Dec. 14; adoption of a resolution authorizing continued remote teleconference meetings of the Lakeport City Council and its legislative bodies pursuant to Government Code section 54953(e); confirmation of the continuing existence of a local emergency for the COVID-19 Public Health Emergency; approval of event application 2022-001, with staff recommendations, for the 2022 Shakespeare in the Park event; adoption of the resolution accepting construction of the North Main Street Paving Project by Argonaut Constructors and authorize the filing of the notice of completion; review and file the first quarter financial update; and approval of the Recognized Obligation Payment Schedule for the period of July 1, 2022 through June 30, 2023, for presentation and adoption by the Lake County Redevelopment Oversight Board.
Email Elizabeth Larson at
The board will meet beginning at 9 a.m. Tuesday, Jan. 4, in the board chambers on the first floor of the Lake County Courthouse, 255 N. Forbes St., Lakeport.
The meeting can be watched live on Channel 8, online at https://countyoflake.legistar.com/Calendar.aspx and on the county’s Facebook page. Accompanying board documents, the agenda and archived board meeting videos also are available at that link.
To participate in real-time, join the Zoom meeting by clicking this link.
The meeting ID is 947 1537 0116, pass code 399006. The meeting also can be accessed via one tap mobile at +16699006833,,94715370116#,,,,*399006#.
All interested members of the public that do not have internet access or a Mediacom cable subscription are encouraged to call 669-900-6833, and enter the Zoom meeting ID and pass code information above.
To submit a written comment on any agenda item visit https://countyoflake.legistar.com/Calendar.aspx and click on the eComment feature linked to the meeting date. If a comment is submitted after the meeting begins, it may not be read during the meeting but will become a part of the record.
The supervisors will begin the meeting by electing the new chair and vice-chair for 2022. Outgoing Chair Bruno Sabatier will conduct the election.
The board will follow up by also selecting the chair and vice-chair for the new year for the Lake County Board of Equalization and the Lake County In-Home Supportive Services Public Authority Board of Directors.
In untimed items, the supervisors will consider the chair’s recommended 2022 committee assignments for board members and vote on appointments to the Cobb Municipal Advisory Council, Hartley Cemetery District and Maternal,Child and Adolescent Health Advisory Board.
The full agenda follows.
CONSENT AGENDA
5.1: Adopt resolution amending Resolution No. 2021-116 establishing position allocations for Fiscal Year 2021-2022, Budget Unit No. 8804, Children and Families First Commission.
5.2: Approve Local Jurisdiction Assistance Grant Program agreement.
5.3: Approve agreement between county of Lake and Redwood Community Services Inc. for the MHSA Transitional Age Youth Drop-In Center Program Expansion for Fiscal Year 2021-22.
5.4: Approve Amendment No. 1 to the agreement between the county of Lake – Behavioral Health Services as lead agency for the Lake County Continuum of Care and Elijah House Foundation for services funded under the Emergency Solutions Grant Coronavirus Program for Fiscal Year 2021-2022.
5.5: Approve Amendment No. 1 to the agreement between county of Lake and Willow Glen Care Center for adult residential support services and specialty mental health services for Fiscal Year 2021-22.
5.6: Approve agreement between county of Lake and Redwood Community Services Inc. for the MHSA Lake County Family Stabilization Program Expansion for Fiscal Year 2021-22.
5.7: Approve Amendment to the Agreement Between County of Lake and Native American Mental Health Services dba North American Mental Health Services for telepsychiatry services for Fiscal Year 2021-22.
5.8: Approve agreement between the county of Lake and Social Services Data Solutions Inc. DBA Decipher HMIS and Impact Homelessness Project for the coordination of activities involved in the compliance with the Lake County Continuum of Care Homeless Management Integration System Software for Fiscal Year 2021-22.
5.9: Approve Board of Supervisors Meeting minutes for June 9, 2021.
5.10: Second reading of ordinance amending Section 21-3.7 Of Chapter 21 of the Ordinance Code of the county of Lake by adopting a sectional district zoning map No. 3.7(B) 1.405.
5.11: Second reading of ordinance amending Ordinance No. 3099 of the County of Lake Code Regulating Microenterprise Home Kitchen Operations and incorporating by reference Health And Safety Code Sections 113789, 113825, 114367, 114367.1 – 114367.6 And 114390.
5.12: Approve first amendment to the contract between county of Lake and North Coast Opportunities Inc. for Stage 1 Child Care Services for the contract dated July 1, 2019, to June 30, 2022, in the amount of $90,000 per fiscal year, and authorize the chair to sign.
5.13: (a) Approve an amendment on our two year lease with Flock Group Inc. for an advanced search feature for automated license plate readers in an amount not to exceed $3,500 per year and (b) authorize the chairman of the Board of Supervisors to sign the agreement.
5.14: Adopt resolution authorizing the county of Lake Water Resources director to accept and execute a US Fish and Wildlife grant for $354,136.37, to improve and enhance the Lake County Invasive Mussel Prevention Program.
TIMED ITEMS
6.2, 9:01 a.m.: Election of chair of the Board of Supervisors and vice-chair of the Board of Supervisors for 2022 (outgoing chair conducts election).
6.3, 9:02 a.m.: Sitting as the Lake County Board of Equalization, election of chair and vice-chair of the Lake County Local Board of Equalization for 2022.
6.4, 9:03 a.m.: Sitting as the Lake County In-Home Supportive Services, election of chair and vice-chair of the Lake County In-Home Supportive Services Public Authority Board of Directors for 2022.
6.5, 11:15 a.m.: Presentation by Graham Knaus, California State Association of Counties executive director.
UNTIMED ITEMS
7.2: Consideration of participation agreement between the California Mental Health Services Authority and Lake County Behavioral Health Services for the Peer Support Specialist Certification Program FY 2021-23.
7.3: Consideration of chairman's recommended 2022 committee assignments for members of the Board of Supervisors.
7.4: Consideration of the following advisory board appointments: Cobb Municipal Advisory Council, Hartley Cemetery District and Maternal, Child and Adolescent Health Advisory Board.
CLOSED SESSION
8.1: Public employee appointment pursuant to Gov. Code Section 54957(b)(1): Appointment of Public Health officer.
Email Elizabeth Larson at
Call Lake County Animal Care and Control at 707-263-0278 or visit the shelter online for information on visiting or adopting.
The following cats at the shelter have been cleared for adoption.

‘Punky’
“Punky” is a 4-year-old male domestic shorthair cat with a yellow tabby coat.
He is in cat room kennel No. 6, ID No. LCAC-A-2417.

‘Dinky’
“Dinky” is a 10-year-old female domestic shorthair cat with a tortie coat.
She is in cat room kennel No. 24, ID No. LCAC-A-2375.

‘Coco’
“Coco” is a 3-year-old female Siamese mix with a short gray, black and white coat, and blue eyes.
She is in cat room kennel No. 33, ID No. LCAC-A-2426.

Male domestic shorthair
This young male domestic shorthair cat has a gray and white coat.
He is in cat room kennel No. 53a, ID No. LCAC-A-2384.

‘Blackette’
“Blackette” is a young male domestic shorthair with a black and white coat.
He is in kennel No. 53b, ID No. LCAC-A-2385.

‘Blackie’
“Blackie” is a young male domestic shorthair with a black and white coat.
He is in cat room kennel No. 53c, ID No. LCAC-A-2386.

Male domestic shorthair
This young male domestic shorthair has a unique striped gray tabby coat.
He is in cat room kennel No. 53d, ID No. LCAC-A-2383.

‘Puff’
“Puff” is a 3-year-old female domestic shorthair mix with white, black, gray and tan markings, and blue eyes.
She is in cat room kennel No. 68, ID No. LCAC-A-2425.

Male domestic shorthair kitten
This male domestic shorthair kitten has an orange tabby coat.
He is in cat room kennel No. 96a, ID No. LCAC-A-1871.

Male domestic shorthair kitten
This male domestic shorthair kitten has an orange tabby coat.
He is in cat room kennel No. 96c, ID No. LCAC-A-1873.

Female domestic shorthair kitten
This female domestic shorthair kitten has an orange tabby coat.
She is in cat room kennel No. 96d, ID No. LCAC-A-1874.

Female domestic shorthair kitten
This female domestic shorthair kitten has a gray tabby coat.
She is in cat room kennel No. 101a, ID No. LCAC-A-1945.

‘Brutus’
“Brutus” is a 6-year-old male domestic shorthair with a brown tabby coat.
He is in cat room kennel No. 146, ID No. 2416.
Email Elizabeth Larson at
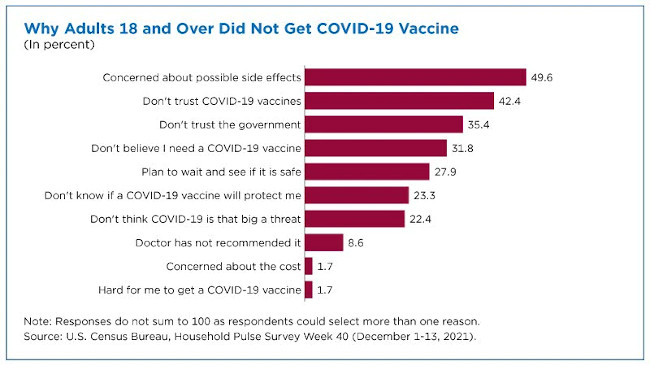
The Centers for Disease Control and Prevention reports that as of Dec. 14, roughly 85% of adults ages 18 and over in the United States had received at least one dose of a COVID-19 vaccine but 15% remained unvaccinated.
Who are the unvaccinated and why are they choosing not to get a COVID vaccine?
According to the U.S. Census Bureau’s newest phase of the experimental Household Pulse Survey, or HPS, those who were unvaccinated against COVID in early December 2021, reported a variety of reasons why.
"Vaccinated" here refers to adults who have received at least one dose of any COVID vaccine, and "unvaccinated" refers to adults who have not received any.
Unvaccinated adults who responded to the survey could select more than one reason:
• About half reported that they were concerned about possible side effects of the vaccine.
• About 42% reported that they “don’t trust the COVID-19 vaccine.”
• Less than 10% reported that they hadn’t gotten the vaccine because their doctor had not recommended it.
• About 2% reported not getting the vaccine because of difficulty obtaining it.
HPS Phase 3.3
The findings are based on the first data from Phase 3.3 of the HPS. These data were collected Dec. 1-Dec. 13 and released in late December.
HPS Phase 3.3 is the latest update to the Census Bureau’s experimental data collection effort to measure the impact of the COVID-19 pandemic on U.S. households.
The new version of the questionnaire is set to continue into February 2022.
For adults 18 and over, a previous question about plans for receiving all required COVID-19 vaccinations was replaced with one focused on the specific number of vaccinations received. There is also a new question about vaccine brands.
Unvaccinated adults younger, less educated
Adults who had not received any doses of the COVID vaccine differed from those who had received at least one dose of a COVID vaccine across several measures.
• They were younger, on average, than those who had been vaccinated. Roughly 75% of the unvaccinated were under age 50. Among the vaccinated, less than half were under age 50.
• They had lower levels of education, on average, than those who were vaccinated. Survey respondents who had received at least one dose were twice as likely as the unvaccinated to have a college degree or higher.
• They were much less likely than vaccinated adults to be married (46% vs 56%).
Racial and ethnic differences
The share of unvaccinated non-Hispanic White adults was not different from the share who were vaccinated. The same was true for Hispanic adults.
But non-Hispanic Black adults were slightly more represented among the unvaccinated (13%) than the vaccinated (11%), a small but statistically significant difference.
There were notable differences for the Asian population, however: 6% of the vaccinated were non-Hispanic Asian but only 1% of the unvaccinated were non-Hispanic Asian.
Who are the hard-to-reach?
Most of the HPS response options are either about information (“Don’t know if it will protect me”) or trust (“Don’t trust the vaccine”).
However, one involves access: “It's hard for me to get a COVID-19 vaccine.”
Who are the people in the small subset of adults who responded to the HPS who reported that they had not gotten a vaccine because it was hard to get?
Compared to all HPS respondents, the hard-to-reach:
• Were more likely to be non-White.
• Were less likely to be married (35% of the hard to reach were married compared to 54% of all respondents).
• Had lower levels of education, on average, and were more economically disadvantaged; about half of this hard-to-reach population reported difficulty meeting expenses in the week prior to the survey.
• Were much more likely to report a disability. The HPS asks about difficulty seeing, hearing, remembering or walking or climbing stairs. Those who reported being unvaccinated because they had no access to the vaccine were almost twice as likely to report either complete impairment or “a lot of difficulty” with one or more of these measures than the general population.
About the data
Approximately 1,044,000 housing units were selected from the sampling frame for this HPS collection period, and approximately 61,000 respondents answered the online questionnaire. Their responses were the basis of this analysis.
The Household Pulse Survey was launched in April 2020, to quickly and efficiently gauge the impact of the coronavirus pandemic on households.
Over the course of 40 collection cycles, HPS data were disseminated in near-real time to inform federal and state response and recovery planning.
The data collected enabled the Census Bureau to produce statistics at the national and state level and for the 15 largest Metropolitan Statistical Areas.
More information is available on these HPS pages: Household Pulse Survey tables, Technical Documentation and Public Use File (PUF) microdata.
Changes in HPS Phase 3.3
The HPS, developed with input from our federal agency partners, continues to measure core demographic household characteristics as well as ask about employment, household spending, food sufficiency, housing security and physical and mental health, and includes a variety of new and adjusted content.
In addition to continuing to ask adults and households with children ages 12-17 about COVID-19 vaccinations and vaccine hesitancy, the survey now asks the same questions for households with children ages 5-11.
Two questions on transportation have returned from previous phases: one about travel before the COVID-19 pandemic began and another about travel in the previous seven days.
A series of questions about unemployment insurance benefits have also been restored.
To reduce respondent burden, the Census Bureau removed a series of questions about summer educational activities for households with children.
The HPS is sent to about a million households every two weeks. If selected, you will receive an email from
Although previous phases of the survey collected and disseminated data every two weeks, Phase 3.3 has shifted to a two-weeks-on, two-weeks-off collection and dissemination approach, with the following anticipated collection periods and data releases:
• Week 40: Dec. 1 – Dec. 13, 2021 (data released Dec. 22, 2021).
• Week 41: Dec. 29, 2021 – Jan. 10, 2022 (data released Jan. 19, 2022).
• Week 42: Jan. 26 – Feb. 7, 2022 (data released Feb. 16, 2022).
In addition to updated detailed tables, upcoming HPS releases will include refreshes to the interactive data tool.
The COVID-19 Vaccination Tracker, which focused on the number of U.S. adults receiving at least one-dose of a COVID-vaccine and attitudes toward the vaccines, was discontinued following Phase 3.2 of the survey.
The tracker was published from April 14-Oct. 20, 2021, and data users can continue to access an archived version of the visualization on the HPS Research and Presentations page or via the Census Bureau’s interactive data visualization gallery.
Lindsay M. Monte is a survey statistician in the Census Bureau’s Program Participation and Income Transfers Branch.
Hi Lady of the Lake!
My name is Cory. I am 10. Where did Clear Lake come from? How was Mount Konocti made? How did the lake fill up with so much water? How old is Clear Lake?
Thank you for answering my questions.
-[Clear Lake Creation Story] Cory
Hello Cory,
Thanks for asking those very important - and interesting - questions. I think this is a great time to answer those questions because we are starting a brand new year, it is a great time to think about new beginnings and the beauty of things and their beginnings. Here in Lake County, we are lucky to see a beautiful Lake and mountain view everyday. The lake and surrounding terrain have an interesting beginning.
In today’s column I am going to talk about the two creation stories of Clear Lake and some of the surrounding mountains. The first story will be focused on the geological, or physical, formation of the lake. The second half of the column will attempt to describe the Pomo creation story - which is just as important as the geologic.
The rocks and layers of the land we see today tell us about the landscape's history, how materials moved, shifted, and fell into the places we see now. The oral histories, told down from the first inhabitants of this land, and sometimes, if we are lucky, captured on paper, also tell us a lot about the shape and structure of the physical world, and how they came to be. I would be remiss if I only told one without the other.
The physical and geological history of Clear Lake
A long time ago, at least a million or two years ago, the valley floor running between the Mayacamas mountain ranges probably contained a large meandering river, with connecting streams, pools, wetlands, marshes, and oxbow lakes. The surrounding mountains and hills allowed rain and snow to flow down into the valley and collect into the streams and lakes and along various depressions.
There has been water, in some form, in the valley for at least 2.5 million years, for as long as the valley has existed. Sediment cores collected in the middle of Clear Lake indicate that lake-like water has been on site of the Upper Arm continuously, for about 500,000 years. The area of the Oaks arm was probably a small lake surrounded by creeks and marshes, with the Lower Arms looking much the same except with a larger river that provided drainage through the Cache Creek outflow.
The valley to the south of the Lower Arm drained into the Sacramento River Basin, but some geologists estimate that there was both a northern and southern drainage, until impoundments at the southern outlet constrained the drainage to the south.
This impoundment caused the rivers to broaden and collect, connecting all the depressions, streams, wetlands and lakes. The specific age of Clear Lake will differ depending on who you talk to, but this is the time period when Clear Lake was “born” into the general shape we recognize today, and most typically estimated at 450,000 years old.
The direction of flow has changed several times over the last mega-annum (i.e. a mega year, or 1 million years) with the basin first forming and flow draining into the Sacramento Valley, much like it does today, through Cache Creek. When volcanic activity was highly active about 200,000 or 300,000 years ago, the landscape shifted, lava flows blocking the southern channel and the sedimentary rising of the southern valley floor, causing an upward “tilt” of the body of water.
Know that some geologists debate the exact land formation that first restricted the flow into the southern channel; some determine it’s lava flows, but some argue the evidence suggests sedimentation from deposition, land shifting and landslide activity. (See Simoons 1949).
Eventually, the water rose enough to push out through northern Cold Canyon and drain solely into the Russian River through the Blue Lakes area. This was the natural flow and direction of Clear Lake for a very long time.
About 10,000 years ago there was a landslide (although some native oral traditions describe it as recently as 2,000 years ago) along the western shore of Clear Lake. This landslide, called the Cow Mountain landslide, caused a blockage at the now western edge of Blue Lakes. This caused Clear Lake to rise even more and push out and erode a newer outlet, along the southern channel into Cache Creek like once before, and where it currently flows today.
You can still see the remnants of the Cow Mountain landslide today, as a prominent tree-covered ridge between Scotts Creek and Blue Lakes once you pass Tule Lake on Hwy 20. With Clear Lake being very shallow, the amount of “tilting” needed on the south or northern end to reverse the drainage of Clear Lake is very minor, probably only a degree or two, causing the needed elevation to shift the drainage directions.
If you want to learn more about landslides and see maps with historic and current landslide prone slopes, you can visit the California Department of Conservation site. This site also has a link to the Reported California Landslide Map where you can report landslides or see if one has been reported near you.
The formation of Mount Konocti and the surrounding elevation is also an interesting story, one with millions of years of dramatic geologic and volcanic activity. A really great reference for understanding the complicated volcanic history in the region is “A Field Trip Guidebook to the Clear Lake Volcanic Field Lake County, California '' published by R. Erickson of Sonoma State and the Northern California Geologic Society (2003). That document can be found for free online at https://scholarworks.calstate.edu/downloads/mk61rk38s?locale=en.
More on the History of Clear Lake can be found on the Water Resources website.
The Pomo Clear Lake and Mount Konocti Creation Story
For this section I provide alternatives or clarifications to specific terms or descriptions using brackets. Anytime [ ___ ] are used, it’s not to provide a conflicting account, but stories change over time and the information might be interpreted or acknowledged differently depending on the time period, the one doing the telling, and the one doing the remembering. This is my attempt to capture and give voice to those differences and nuances within this single retelling.
Like most Native American sacred stories, the majority of local tribes’ histories, stories, and legends, are passed down through oral tradition, descending upon generation and generation. Some accounts have been captured on paper, for which a researcher as myself is most grateful. However, as I am not tribal myself, I did reach out to several sources and confirm this particular creation story for accuracy and cultural competency, so that it best serves and pays homage to the intent of the oral traditional spirit of the local indigenous Native people of Lake County.
A note on the general use of “Pomo” as describing the native peoples within Lake County. While the Federal Government recognizes Pomo as the descriptor for the local native indigenous Native peoples, local tribes refer to themselves as “Hinthil” or “Gowk Xabatin."
Today I will highlight the story of Lupyoma [or sometimes referred to as Lupiyomi], the creation story of Mount Konocti and Clear Lake. Clear Lake is known as Ka-ba-tin [Xa’Batin] or Hok-has-ha, meaning “Big Water'' in native Pomo. You should be aware that there is always more than one story, much like geology relays layers of depth and time’s influence on the landscape, so do histories and legends, including the written words and pronunciations.
A note on the meaning and pronunciation of Kabatin vs Xa’Batin: Ka means spider, but the sound for Xa is more of a sound for “H,” think of the sound when you say the name “Howard.” Some people associate the sound with a “K,” which in many instances wrote the name as Kabatin which would actually mean big spider. A good way to sum it up is as follows: Xa = Water, Ka=Spider, Batin=Big, Giant or Tall. (Thanks to EJ Crandell for the helpful clarification and pronunciation guidance.)
Some stories and meanings vary by region, dialect and differ depending on what side or region of Clear Lake they are being told. I relay this specific version of the story based on several in-person sources, mostly casual conversations, and mostly supported by the version from the book Pomo Indians: Myths and Some of their Sacred Meanings by Clark and Williams (Vantage Press Inc., New York, 1954). The story specifics are credited to this reference. This book is available online and from several local sources like Watershed Books in Lakeport.
The Sun Man, Kabel [sometimes Kahbel or Kah-bel], of the Bartlett Mountain tribe, saw a beautiful maiden walking along the shores of the lake. She was Princess Lupyoma, and her father was the Chief named Konocti. Konocti refused to let Kabel marry Lupyoma but she was in love with Kabel and they decided to elope.
In the evening dusk, Kabel and Lupyoma stole away in Kabel’s canoe, attempting to return to Kabel’s people. Konocti saw them escaping when he came out of his longhouse [Tule Hut] and in a rage he started throwing mighty boulders at Kabel. Kabel retaliated by shooting arrows from his strong bow.
Kabel was struck with a boulder and fell dead, but he was able to shoot off one more arrow which flew and struck Konocti in the heart. The rocky shores along the Buckingham Peninsula and Anderson Island are remnants from that great boulder and arrow battle.
Konocti’s body fell and created the great Mount Konocti that shapes the southern edge of Clear Lake. Kabel’s body fell into the land on the north side of the Narrows and his blood creates the color of the red rocks within the hills of the Eastern North shore.
Lupyoma was stricken with grief and threw herself into the water, being swept away in the current, her tears pooling and bubbling and creating the springs and vents in the vicinity of today’s Soda Bay. Her tears are still bubbling and filling the lake to this day.
Another version of this story puts Kabel’s hometown or tribe located somewhere in the Lower Lake area, so his blood creates the Red Hills in the southern shore. The salty tears of Lupyoma created Little Borax Lake situated at the base of Mount Konocti on the Buckingham Peninsula.
There are probably other versions and variations yet still, but the sentiment is the same, and just as important to consider and acknowledge as Clear Lake’s geological past and history.
Sincerely,
Lady of the Lake
Angela De Palma-Dow is a limnologist (limnology = study of fresh inland waters) who lives and works in Lake County. Born in Northern California, she has a Master of Science from Michigan State University. She is a Certified Lake Manager from the North American Lake Management Society, or NALMS, and she is the current president/chair of the California chapter of the Society for Freshwater Science. She can be reached at
I want to extend a very special thank you to those who helped me in the development of this column. Firstly, I thank Eddie “EJ” Crandell (and an anonymous elder) for the review and comments to improve the telling and interpretation of Lupyoma history. Secondly, thanks to Harry Lyons for providing geological context and resources, some of which I have cited and linked within the column. Thank you to my native indigenous friends and colleagues, from Lake County and elsewhere, who let me pick their brains and ask questions about their traditions and pronunciations, not just for this column, but always.
A very useful resource for this article was a Master's Thesis submitted by F. J. Simoons in the Department of Geography at UC Davis in 1949. “The Settlement of the Clear Lake Upland of California”. Available as hardcopy in the County of Lake Water Resources Library (707-263-2344) and Google Books.
Another Useful geology reference is “Clear Lake Geology: Field Trip Guide for Teachers” by Dean A. Enderline (2007) prepared under the direction of the LAKE Science Collaborative of Lake County, CA. Available from Dean’s website and the County of Lake Water Resources Library (707-263-2344).

A calorie is a calorie is a calorie, at least from a thermodynamic standpoint. It’s defined as the amount of energy needed to raise the temperature of 1 kilogram of water by 1 degree Celsius (2.2 pounds by 1.8 degrees Fahrenheit).
But when it comes to health and your body’s energy balance, not all calories are equal.
For example, some studies have reported that diets that are high-protein, low-carbohydrate or a combination of the two do yield greater weight loss than diets with other levels of fat, protein and carbs.
If every calorie in food were the same, you wouldn’t expect to see weight-loss differences among people who eat the same number of calories that are doled out in different types of food.
Dietitians like me know there are many factors that influence what a calorie means for your body. Here’s what we understand about calories and nutrition so far.
Energy actually available to your body
In the late 1800s, chemist W.O. Atwater and his colleagues devised a system to figure out how much energy – that is, how many calories – various foods contain. Basically, he burned up food samples and recorded how much energy they released in the form of heat.
Not every bit of energy in food that can combust in the lab is actually available to your body, though. What scientists call metabolizable energy is the difference between the total energy of the food consumed and the energy that passes out of your body, undigested, in feces and urine. For each of the three macronutrients – proteins, carbohydrates and fats – Atwood devised a percentage of the calories they contained that would actually be metabolizable.
According to the Atwater system, one gram of each macronutrient is estimated to provide a certain number of calories. The U.S. Department of Agriculture still uses these calculations today to come up with an official calorie number for every food.
How much energy you use
What you eat can affect what scientists call your body’s energy expenditure. That’s how much energy it takes to keep you alive – energy you use breathing, digesting, keeping your blood flowing and so on – along with what you exert moving your body. You might have heard this referred to as metabolism.
Diet quality can alter the body’s energy expenditure, which is also called the thermic effect of food. For example, in one study, people eating the same number of calories per day but on either a low-carbohydrate diet or a low-fat diet had differences in total energy expenditure of about 300 calories per day. Those eating very low-carb diets used the most energy, while those eating low-fat diets used the least.
In another study, high-fat diets led to lower total energy expenditure than high-carb diets did. Other researchers reported that although substituting carbs for fat did not alter energy expenditure, people who increased their protein intake to 30%-35% of their diet used more energy.
In general, diets high in carbohydrates, fat or both produce a 4%-8% increase in energy expenditure, while meals high in protein cause an 11%-14% increase above the resting metabolic rate. Protein has a higher thermic effect because it’s harder for the body to break down. Although these variations aren’t huge, they could contribute to the obesity epidemic by encouraging a subtle average weight gain.

Quality of the calories you eat
Dietitians pay attention to a food’s glycemic index and glycemic load – that is, how quickly and how much it will increase your blood glucose levels. A rise in blood glucose triggers the release of insulin, which in turn influences energy metabolism and storage of excess energy as fat.
Foods like white rice, cakes, cookies and chips are all high on the glycemic index/load. Green vegetables, raw peppers, mushrooms and legumes are all low on the glycemic index/load. There is some evidence to suggest that foods lower on the glycemic index/load may be better for keeping blood sugar levels regulated – regardless of the calories they contain.
Reward centers in the brain light up when people eat high glycemic index/load foods, highlighting the pleasurable and addictive effect of foods like candy or white breads.
The fiber content of food is another thing to consider. Your body can’t digest fiber – found in plant foods like fruits, vegetables, whole grains and beans – for energy. So foods high in fiber tend to have less metabolizable energy and can help you feel full on fewer calories.
Empty calories – those from foods with minimal or no nutritional value – are another factor to consider. Things like white sugar, soft drinks and many ultra-processed snacks don’t provide much, if any, benefit in the form of protein, vitamins or minerals along with their calories. The opposite would be nutrient-dense foods that are high in nutrients or fiber, while still being relatively low in calories. Examples are spinach, apples and beans.
And don’t think of empty calories as neutral. Nutritionists consider them harmful calories because they can have a negative effect on health. Foods that are the biggest contributors to weight gain are potato chips, potatoes, sugar-sweetened beverages and meats, both processed and unprocessed. On the other hand, foods that are inversely associated with weight gain are vegetables, whole grains, fruits, nuts and yogurt.

More to health than calories and weight
It is indisputable that for weight loss, the difference between the number of calories consumed and the number of calories exerted through exercise is the most important factor. But don’t fool yourself. While weight plays a role in health and longevity, weight loss alone doesn’t equate to health.
Yes, some high-protein diets seem to promote weight loss at least in the short term. But epidemiologists know that in areas where people live the longest – close to 100 years on average – they eat a primarily plant-based diet, with very low or no animal-based protein and low or moderate fat in the form of mono- and polyunsaturated fats.
I often hear friends or clients say things like “it’s those carbs that are making me fat” or “I need to go on a low-carb diet.” But these complaints drive dietitians like me, well, nuts. Carbohydrates include foods like Coca-Cola and candy canes, but also apples and spinach. Cutting down on simple carbs like soft drinks, refined-flour bakery items, pasta and sweets will definitely have a positive impact on health. But eliminating carbohydrates like vegetables and fruit will have the opposite effect.
A plant-based diet high in plant-based protein and carbohydrates mostly from vegetables, fruit, nuts and legumes is the healthiest diet researchers know of for longevity and prevention of chronic diseases like heart disease, cancer, hypertension and many other conditions.
The modern Western diet suffers from an increase in quantity of calories consumed with a concurrent decrease in the quality of calories consumed. And researchers now know that calories from different foods have different effects on fullness, insulin response, the process of turning carbs to body fat, and metabolic energy expenditure.
Where your health is concerned, count more on the quality of the calories you consume than the calorie count.
[Get the best of The Conversation, every weekend. Sign up for our weekly newsletter.]![]()
Terezie Tolar-Peterson, Associate Professor of Food Science, Nutrition & Health Promotion, Mississippi State University
This article is republished from The Conversation under a Creative Commons license. Read the original article.