 How to resolve AdBlock issue?
News
The Employment Development Department reported that Lake County’s unemployment rate was 5.1% in December, down from the 5.3% rate reported in November.
In December 2021, Lake County’s jobless rate was 5.8%.
The state of California’s unemployment rate in December was 4.1%, the same as November 2022’s rate. The state jobless rate in December 2021 was 5.8%.
The Bureau of Labor Statistics said the national unemployment rate in December 2022 was 3.5%, compared to 3.6% in November and 3.9% in December 2021.
In Lake County in December, the workforce totaled 28,130 individuals, with 1,430 unemployed.
Most industry sectors in Lake County showed drops in job numbers or no change, with the exception of professional and business services, which showed an increase of 2.8%, and retail trade, up by 0.4%.
California payroll jobs totaled 17,761,900 in December 2022, up 16,200 from November 2022 and up 621,400 from September of last year.
The number of Californians employed in December was 18,440,500, a decrease of 20,000 persons from November’s total of 18,460,500, but up 589,500 from the employment total in December, according to the report.
The Employment Development Department said the number of unemployed Californians was 782,300 in December, a decrease of 6,700 over the month and down 312,800 in comparison to December 2021.
Total nonfarm jobs in California’s 11 major industries totaled 17,761,900 in December — a net gain of 16,200 from November. This followed a downward revised (-6,900) month-over gain of 19,900 jobs in November, the state said.
The report said total nonfarm jobs increased by 621,400 (a 3.6% increase) from December 2021 to December 2022 compared to the U.S. annual gain of 4,503,000 jobs (a 3% increase).
The number of jobs in the agriculture industry increased from November by 5,100 to a total of 416,200 jobs in December. The agricultural industry had 4,900 more farm jobs in December 2022 than it did in December a year ago, the state said.
The Employment Development Department said December 2022 marked the 15th consecutive month of nonfarm job gains, which now totals 807,300 jobs over that time period for a monthly average gain of 53,820 jobs.
Year over, California job growth at 3.6% has outpaced the U.S. as a whole at 3% by 0.6 percentage points and the state has 70,000 more jobs than pre-pandemic levels in February 2020.
In other news, nine of California’s 11 industry sectors gained jobs in December with education and health services (+8,200) showing the largest month-over gains thanks to strength in home health care services, residential care facilities, and individual and family services, the Employment Development Department reported.
Construction (+7,500) also enjoyed a strong month-over gain of more than 7,500 jobs thanks, in part, to good gains in specialty trade contractors, the report showed.
The state said trade, transportation and utilities (-11,100) suffered from losses in merchant wholesalers of both durable and nondurable goods, as well as with reductions in retail trade, including health and personal care stores and office supplies, stationary, and gift stores.
Lake County’s unemployment rate last month earned it the No. 41 ranking statewide among the state’s 58 counties.
San Mateo continued to have California’s lowest unemployment rate, 1.9%, while Imperial had the highest, 14.8%.
Lake’s neighboring county jobless rates and ranks were: Colusa, 12.2%, No. 57; Glenn, 5.2%, No. 42; Mendocino, 3.8%, No. 26; Napa, 3%, No. 14; Sonoma, 2.5%, No. 6; and Yolo, 3.6%, No. 22.
In related data that figures into the state’s unemployment rate, there were 326,252 people certifying for Unemployment Insurance benefits during the December 2022 sample week. That compares to 306,550 people in November and 355,749 people in December 2021.
Concurrently, 41,550 initial claims were processed in the December 2022 sample week, which was a month-over decrease of 6,271 claims from November and a year-over decrease of 7,521 claims from December 2021.
Email Elizabeth Larson at
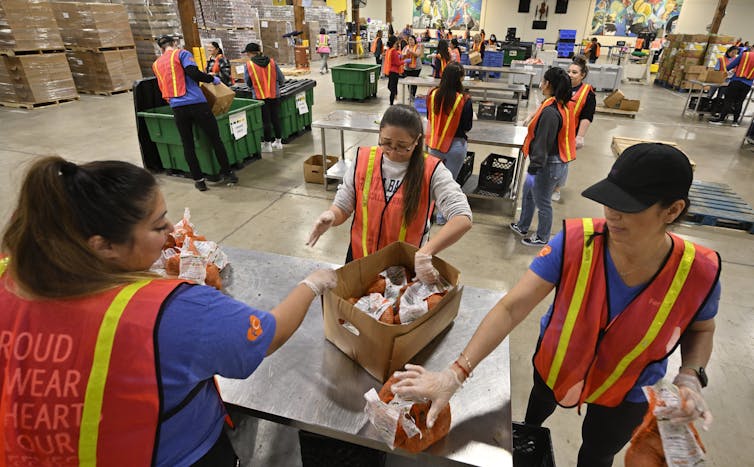
Grocery prices soared by 11.8% in 2022 – the swiftest pace since the early 1980s. Rapid inflation is, naturally, leading to concerns that it’s getting harder for Americans to put food on the table.
Indeed, Feeding America, a nonprofit that supports and connects roughly 60,000 food banks and pantries nationwide, has said that at least half of its members are seeing more demand for their services. And many journalists are reporting about struggling parents waiting in long lines for free food.
We are experts on food and agricultural economics. Together we have created a new data dashboard that tracks U.S. food insecurity – the technical term for having trouble getting enough nutritious food – based on publicly available information.
The data we’re collecting ourselves, as well as the information that we’ve compiled from other sources, including the Census Bureau, isn’t yet reflecting a sharp uptick in households without enough to eat. U.S. food insecurity has remained at troubling and yet relatively flat levels.
Based on all the data we’ve included in our dashboard, we estimate that over the course of 2022 somewhere between 11% and 15% of those living in the U.S. struggled with securing their next meal.
This range relies, in part, on internet-based surveys that can often produce food insecurity estimates that are higher than official government data. Because it is expensive to reach a true random sample of Americans, cheaper online surveys are commonly unrepresentative of the U.S. population but still prove to be a key tool for measuring changes compared with previous online surveys.
Official estimates are delayed and possibly low
Food insecurity is officially assessed based on a series of survey questions developed by the U.S. Department of Agriculture Economic Research Service. Every December, the federal government uses this measure to assess food insecurity for the past year. Following extensive analysis, it releases that data in September of the next year.
The official food insecurity rate hovered around 10.5% from 2019 to 2021, according to the USDA.
During those same three years, however, other researchers detected both lower and much higher rates. Our average of these surveys suggests that national levels may have peaked at nearly 19% in the months following the onset of the COVID-19 pandemic the U.S. in March 2020.
Within about six months, food insecurity returned to the 10%-11% range, based on our average of available data.
A mismatch between the facts and the coverage
Why are reports of long lines at food banks and increased demand for free food apparently at odds with the relative stability in the national food insecurity rate?
One reason could be that food insecurity rates, which generally overlap with social and economic inequality, can differ sharply.
For example, Nassau County, which spans many of New York City’s largely affluent Long Island suburbs, had a food insecurity rate of 5.7% in 2020. In nearby Bronx County, New York state’s lowest-income county, the food insecurity rate was more than three times that, at 19.7%, according to Feeding America’s Map the Meal Gap study.
As a result, food security can get worse or better in particular communities without affecting the national rate.
Another explanation could be that government programs and nonprofits that help people get enough food are succeeding. The number of people getting Supplemental Nutrition Assistance Program benefits, sometimes referred to as “food stamps” and generally just called SNAP, increased by 2.8% from January to October 2022, to 42.3 million.
In some states, SNAP benefits remain at the elevated levels instituted when the COVID-19 pandemic began.
Survey data from our Consumer Food Insights reports also shows that the average length of time households receive SNAP benefits increased from 9.5 months to 12.4 months in 2022.
Nearly 7% of households were visiting food pantries in December 2022, according to the Census Bureau, up from 4.4% in 2019. At the same time, the USDA announced an additional US$2 billion in funding to emergency food providers to deal with elevated food costs.
The charitable food system is decentralized, making it hard if not impossible to determine whether the amount of food donated to Americans overall has changed. As Feeding America reports, the 2.5 billion meals that its network provided in the first half of 2022 came from a range of donors, with its corporate partners playing a big role.
The data further suggests that, while consumer confidence about the overall economy is at a historically low level, fears of an economic downturn don’t reflect the fact that many people still have more money saved up than they did before 2020. Similarly, unemployment, which dipped to 3.5% in December 2022, is at the historically low levels last seen before the COVID-19 pandemic.
Finally, researchers have found that incomes over time and accumulated savings are more closely tied to whether families will experience food insecurity than what their breadwinners currently earn. Because the disposable incomes of many Americans rose in 2020 and 2021, it will probably take a deeper economic shock than the nearly 12% increase in grocery prices registered between December 2021 and December 2022 to make food insecurity soar.
Getting clearer pictures
To be clear, we do not mean to suggest that food insecurity is not a serious issue or that having more than 1 in 10 Americans struggle to get enough to eat is acceptable.
Rather, we noticed that policy and research interest in food insecurity spiked in the year following COVID-19 shutdowns, resulting in much more data on the topic before dwindling in 2021. Today, the public is paying more attention to the topic again.
Food banks and SNAP benefits collectively have provided around $130 billion in annual economic relief for low-income Americans in recent years, a number that includes a sharp increase in benefits. We believe that these efforts are vital.
We propose that conducting and releasing more frequent high-quality surveys would help bring sustained attention to the issue, clarify trends and allow experts like us to make better predictions.
And because all food insecurity surveys are subject to sampling errors and offer only a snapshot regarding a single time frame, we believe that pooling the multiple surveys featured in our data dashboard can better inform policymakers and charities that seek to address food insecurity and rapidly respond when levels spike.![]()
Sam Polzin, Food and Agriculture Survey Scientist, Purdue University and Jayson Lusk, Professor of Agricultural Economics, Purdue University
This article is republished from The Conversation under a Creative Commons license. Read the original article.
The board will meet beginning at 9 a.m. Tuesday, Jan. 24, in the board chambers on the first floor of the Lake County Courthouse, 255 N. Forbes St., Lakeport.
The meeting can be watched live on Channel 8, online at https://countyoflake.legistar.com/Calendar.aspx and on the county’s Facebook page. Accompanying board documents, the agenda and archived board meeting videos also are available at that link.
To participate in real-time, join the Zoom meeting by clicking this link.
The meeting ID is 916 9197 9076, pass code 273543. The meeting also can be accessed via one tap mobile at +16694449171,,91691979076#,,,,*273543#.
All interested members of the public that do not have internet access or a Mediacom cable subscription are encouraged to call 669-900-6833, and enter the Zoom meeting ID and pass code information above.
To submit a written comment on any agenda item visit https://countyoflake.legistar.com/Calendar.aspx and click on the eComment feature linked to the meeting date. If a comment is submitted after the meeting begins, it may not be read during the meeting but will become a part of the record.
Among the board’s timed items for Tuesday, during a public hearing scheduled for 9:15 a.m., Cal Fire will present the new fire hazard severity zone map.
At 10 a.m., the board will consider a memorandum of understanding between the county of Lake and the city of Clearlake for the design cost related to the regional skate park to be located in Clearlake, in District 2.
At 1:30 p.m., there will be informational presentations by Big Valley Band of Pomo Indians, California Department of Fish and Wildlife, California Fish and Game Commission, Chi Council for the Clear Lake Hitch, Lake County Agriculture Advisory Committee, Lake County Water Resources Department, Robinson Rancheria and State Water Resources Control Board regarding the current status of the Clear Lake hitch, or chi, which was the focus of a special listening session on Thursday and will be featured in another on Feb. 1.
The board will also consider a draft proclamation declaring a Clear Lake hitch emergency. That proposal was held over from the board’s Jan. 10 meeting.
Among the meetings is an untimed item in which the board will consider an application from a new nonprofit, Chico-based North State Solutions, to purchase remaining tax defaulted properties from the June property tax sale.
Treasurer-Tax Collector Patrick Sullivan’s report to the board explained that for the dozens of properties North State Solutions is offering $354,934.60, which he said is a significant potential discount from the assessed value. He cites other concerns, including a burden on county staff to monitor the nonprofits proposal “to otherwise serve low-income persons.”
Among the listed properties for sale are numerous lots in the paper subdivisions on the Northshore, which cannot be developed for numerous reasons, including lack of infrastructure and roads, and unstable slopes and soil.
Sullivan is recommending the board deny the application by North State Solutions for the properties.
Also in untimed items, the board will consider an agreement between the county of Lake and Sunrise Special Services Foundation for emergency warming shelter services in the amount of $153,600 for fiscal year 2022-23 and authorize the board chair to sign.
In a related untimed item, the supervisors will consider a proclamation declaring a shelter crisis urgency due to the current need for sheltering for those experiencing homelessness during the weather and temperature patterns that the county of Lake has been experiencing.
The full agenda follows.
CONSENT AGENDA
5.1: a) Approve agreement between the county of Lake and Community Development Services to provide loan servicing to the Community Development Block Grant Business Loan Program, and authorize chair to sign; and b) approve agreement between the county of Lake and Community Development Services for the Community Development Block Grant Microenterprise Technical Assistance Program, and authorize chair to sign.
5.2: Adopt resolution approving Agreement No. 22-SD17 with California Department of Food and agriculture for compliance with the Seed Services Program for the period July 1, 2022, through June 30, 2023.
5.3: Approve software upgrade for existing services between county of Lake and Granicus for county clerk services in the amount of $44,980.00, and authorize the chair to sign.
5.4: Approve Amendment No. 1 to the agreement between the county of Lake and Vista Pacifica Enterprises Inc. for adult residential support services and specialty mental health services for fiscal year 2022-23 in the amount of $239,040.00 and authorize the board chair to sign.
5.5: Approve Board of Supervisors minutes for Oct. 18, 2022, and Dec. 13, 2022.
5.6: Approve late mileage claims for the planning commissioners in the amount of $1,239.34.
5.7: Adopt resolution amending Resolution No. 2017-27 establishing the Scotts Valley Community Advisory Council in order to require staggered terms of office for council members.
5.8: Authorize destruction of records by the Registrar of Voters Office.
5.9: Adopt proclamation commending Tina Dawn Rubin for her 22 years of service to the county of Lake.
5.10: Approve Amendment No. 2 to the agreement between the county of Lake and Management Connections for temporary clerical personnel in the county of Lake Human Resources Office for an increase of $50,000 and a total not to exceed $75,000 and authorize the chair to sign.
5.11: a) Waive the formal bidding requirement; and b) authorize the IT director to issue a purchase order to Eplus Technology Inc. for the renewal of Palo Alto Networks Firewall support and security licensing.
5.12: a) Waive the competitive bidding pursuant to section 38.2 due to the unique nature of the goods or services; and b) approve contract between the county of Lake and Lake Transit Authority for local public transportation services in the amount of $65,600, from July 1, 2022, to June 30, 2025, and authorize the chair to sign.
5.13: a) Waive the competitive bidding pursuant to section 38.2 due to the unique nature of the goods or services; and b) approve contract between county of Lake and Lake Family Resource Center for domestic violence services, in the amount of $25,000 per fiscal year from July 1, 2022, to June 30, 2025, and authorize the chair to sign.
TIMED ITEMS
6.2, 9:10 a.m.: Presentation of proclamation commending Tina Dawn Rubin for her 22 years of service to the county of Lake.
6.3, 9:15 a.m.: Public hearing, fire hazard severity zone map presented by Cal Fire.
6.4, 9:45 a.m.: Public meeting to allow public testimony by members of the public to provide comments on the renewal of the Lake County Tourism Improvement District and levy of assessments.
6.5, 10 a.m.: Consideration of memorandum of understanding between the county of Lake and the city of Clearlake for the design cost related to the regional skate park in District 2.
6.6, 10:30 a.m.: Presentation of work plan for the Office of Climate Resiliency.
6.7, 11 a.m.: Public hearing, consideration of draft ordinance amending Chapter 21, Article 58 and Article 68 of the Lake County Zoning Ordinance relating to appeals.
6.8, 11:30 a.m.: Public hearing, consideration of draft ordinance amending Chapter 5, Section 2 of the Lake County Code, setting forth procedures for expediting permit processing for electric vehicle charging stations, as required by Government Code Section 65850.7 (AB 1236, 2015, Chiu).
6.9, 1 p.m.: Consideration of letter of support for Lake County Land Trust property acquisition.
6.10, 1:30 p.m.: a) Informational Presentations by Big Valley Band of Pomo Indians, California Department of Fish and Wildlife, California Fish and Game Commission, Chi Council for the Clear Lake Hitch, Lake County Agriculture Advisory Committee, Lake County Water Resources Department, Robinson Rancheria and State Water Resources Control Board pertaining to current status of the Clear Lake Hitch, or Chi, and b) consideration of draft proclamation declaring a Clear Lake hitch emergency.
UNTIMED ITEMS
7.2: Sitting as the Lake County Air Quality Management District Board of Directors, consideration of memorandum of understanding by and between the county of Mendocino and the Lake County Air Quality Management District for air pollution control officer duties, effective Feb. 1, 2023.
7.3: Consideration of agreement between county of Lake and Sunrise Special Services Foundation for Emergency Warming Shelter Services in the amount of $153,600 for FY 2022-23 and authorize the board chair to sign.
7.4: Consideration of the following Advisory Board Appointment: East Region Town Hall, Fish and Wildlife Advisory Committee, Lower Lake Waterworks District One Board of Directors, Maternal Child and Adolescent Health Advisory Board.
7.5: Consideration of update and appointment to the 2023 committee assignments for members of the Board of Supervisors.
7.6: Consideration of proposed findings of fact and decision in the appeal of Monte Cristo Vineyard LLC (AB 22-03).
7.7: a) Consideration of Creation of Section 19 of the “Board of Supervisors, County of Lake, CA, Policies and Procedures Manual,” and; b) consideration of approval of Section 19.1.
7.8: Consideration of update on Lake County recreation center efforts.
7.9: Consideration of North State Solutions’ application to purchase remaining tax defaulted properties.
7.10: Addendum, consideration of proclamation declaring a shelter crisis urgency due to the current need for sheltering for those experiencing homelessness during the weather and temperature patterns that the county of Lake has been experiencing.
Email Elizabeth Larson at
LAKE COUNTY, Calif. — The United States Environmental Protection Agency will hold two online question and answer sessions on its cleanup plan for the Sulphur Bank Mercury Mine Superfund site in Clearlake Oaks.
The EPA will provide information and updates related to the proposed plan, offer time for questions-and-answers, and an opportunity to submit official written comments.
The sessions will take place on Jan. 25 and Feb. 2.
The information session is as follows.
Wednesday, Jan. 25, 5:30 to 7:30 p.m.
Whole community
Zoom meeting: https://us06web.zoom.us/j/89603074296
Phone: 253-215-8782
Meeting ID: 896 0307 4296
Thursday, Feb. 2, 5:30 to 7:30 p.m.
Tribal focused
Zoom meeting: https://us06web.zoom.us/j/83515748692
Phone: 253-215-8782
Meeting ID: 835 1574 8692
The prerecorded presentation of the proposed plan can be seen in the video above.
To view the detailed documents on how EPA developed cleanup options, please visit the website’s Site Document and Data tab or click here.
To view at a glance information about the proposed plan, please click here.
Several key site documents in the record, the proposed plan and other files will be made available in hard copy at the locations below and will remain there throughout January/ February. Please call locations to confirm hours/availability.
Redbud Library
14785 Burns Valley Road, Clearlake
707-994-5115
Lake County Library
1425 N. High St., Lakeport
707-263-8817
Superfund Records Center
75 Hawthorne St., San Francisco
415-947-8000
For any other questions related to the proposed plan please contact me, Gavin Pauley, the site’s community involvement coordinator,

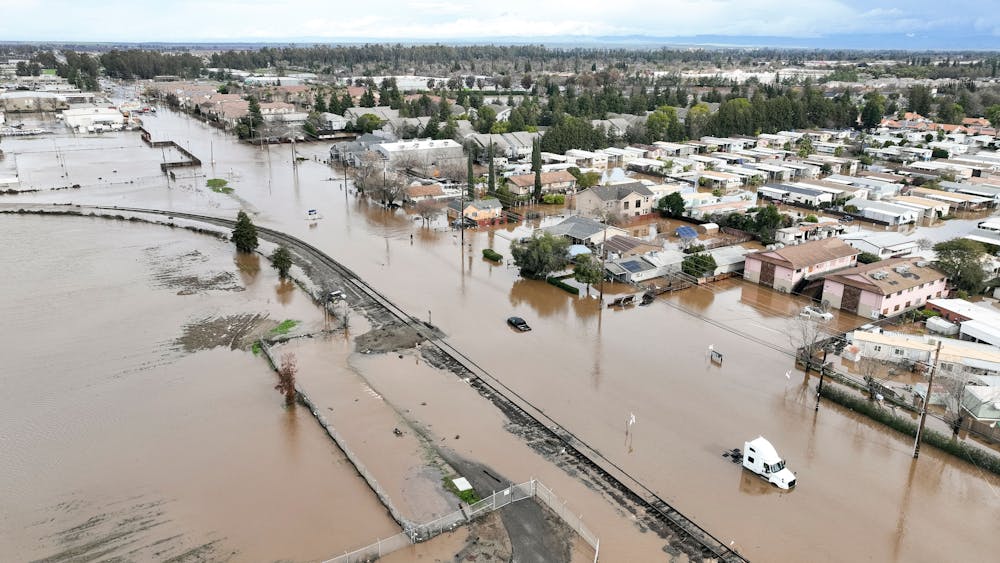
The extreme flooding and mudslides across California in recent weeks took many drivers by surprise. Sinkholes swallowed cars, highways became fast-moving rivers of water, entire neighborhoods were evacuated. At least 20 people died in the storms, several of them after becoming trapped in cars in rushing water.
As I checked the forecasts on my cellphone weather apps during the weeks of storms in early January 2023, I wondered whether people in the midst of the downpours were using similar technology as they decided whether to leave their homes and determined which routes were safest. Did they feel that it was sufficient?
I am a hydrologist who sometimes works in remote areas, so interpreting weather data and forecast uncertainty is always part of my planning. As someone who once nearly drowned while crossing a flooded river where I shouldn’t have, I am also acutely conscious of the extreme human vulnerability stemming from not knowing exactly where and when a flood will strike.
About two-thirds of flood-related fatalities in the U.S. are classified as “driving” and “in water.” If people had known the likelihood of flooding in those locations in real time – via a cellphone app or website – it’s possible some of these deaths could have been avoided.
Yet even emergency management personnel currently operate with surprisingly little information about when and where flooding is likely to strike. They know where flooding may occur, particularly along rivers. But each flood is different, and key questions, such as which roads can safely be used and which populations are exposed, still require firsthand observation.

I have been working with colleagues to develop a method that gets around the current roadblocks to that kind of forecasting. Using “probabilistic learning” – a type of machine learning – the method can create local flood hazard models that can pinpoint conditions street by street using real-time storm forecasts.
The flood forecast challenge
Computer programs that can predict what happens to rainwater after it hits the ground are the ultimate tools for predicting in real time where and when floods will strike.
However, such flood models require immense amounts of computing power. Currently there is no means to quickly predict flooding in real time just anywhere. The level of detail relevant to human decisions – representing buildings, evacuation routes or infrastructure assets – is out of reach.
A second challenge is the high uncertainty in precipitation forecasts and many other inputs of flood models.
Research over the past decades explored the possibilities of solving these formidable challenges using “brute force” approaches: faster computers and more computers. Ultimately, it suggests a need to rethink how we forecast floods.
Designing effective local flood forecasts
The approach we developed tackles these challenges by using a sophisticated flood model to develop and train simpler models that can then mimic flood behavior in local environments at nearly the same level of accuracy as their more powerful teacher. Importantly, we have shown in studies that even a personal computer can then use these simpler models to forecast flooding in real time. Perhaps even a cellphone.
To forecast flooding, one needs to predict how flooding starts and evolves in urban communities – with a high level of detail and an understanding of the bounds of uncertainty around the prediction.
Our approach builds on key information that many cities already have: detailed data on topography of their communities and the surrounding watershed, how land is used, the layout of buildings and roads, and the characteristics of stormwater drains and pipes, such as how much water they can carry. Pavement and outdated stormwater infrastructure in particular can affect how water flows and which areas flood in an urban environment.
We then use one of the most up-to-date, sophisticated flood models available to train simpler models.
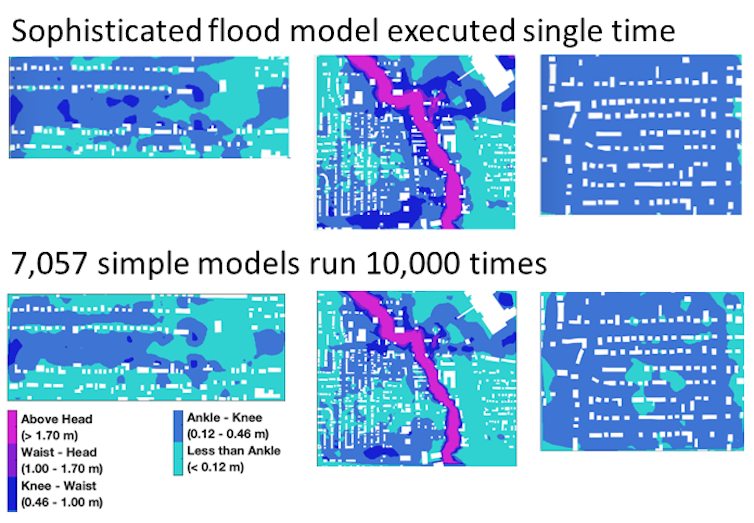
These simpler models are faster and require far less computing power because they use extremely simple functions, and each focuses on a single variable at a given location and time such as, for example, inundation level or water flow velocity. Thousands of them can provide a remarkably accurate picture of likely flooding when real-time weather forecast information is added.
The crucial point is that these simpler models are developed in the “off time” – well before the storms. These analyses can be performed using a freely available toolkit developed by the Department of Energy.
This approach replaces the nearly impossible burden of computation in real-time with the easier task of using previously trained, simple models of the local community.
We demonstrated the approach in a study using the 2017 flooding in Houston from Hurricane Harvey. The results showed that a computational problem that would otherwise take years to run on a typical computer can be executed in just a few seconds with a comparable level of accuracy.
Looking ahead
As global warming increases rainfall intensity and populations grow, flood risks will rise. Another increasingly recognized problem is that the standards of how communities manage stormwater are based on the climate of the past. Existing storm drains and pipes simply cannot handle the additional water, increasing the costs of flood damage.
While further work is needed to put this into wide use, we believe the method opens avenues for making flood forecasting more relevant, detailed and accurate. It also offers the means of assessing the adequacy of existing stormwater infrastructure and can be restyled to assess the impact of other hard-to-quantify natural hazards, such as landslides and fires.
Cities with high home values are likely to see more flood-forecasting services from the private sector. However, government agencies could use this kind of novel modeling to expand their forecasting mission to assist everyone. One could envision counties, with the right skills and resources, providing local flood forecasting. Who, if not the local communities, is most vested in the effective flood response management and mitigation?![]()
Valeriy Ivanov, Professor of Hydrosystems Engineering, University of Michigan
This article is republished from The Conversation under a Creative Commons license. Read the original article.
Call Lake County Animal Care and Control at 707-263-0278 or visit the shelter online at http://www.co.lake.ca.us/Government/Directory/Animal_Care_And_Control.htm for information on visiting or adopting.
The following cats at the shelter have been cleared for adoption.

‘Ozzy’
“Ozzy” is a 2-year-old Siamese cat.
He is in cat room kennel No. A3, ID No. LCAC-A-4555.

Male domestic medium hair
This 3-year-old male domestic medium hair cat has a gray coat.
He is in cat room kennel No. 13, ID No. LCAC-A-4559.

Female domestic longhair cat
This 1-year-old old female domestic longhair cat has a gray coat.
She is in cat room kennel No. 56, ID No. LCAC-A-4556.

‘Sonny’
“Sonny” is a 2-year-old male orange tabby with a short coat.
He is in cat room kennel No. 57b, ID No. LCAC-A-4372.

Male Siamese kitten
This 3-month-old male Siamese kitten has a medium length white coat and blue eyes.
He is in cat room kennel No. 60a, ID No. LCAC-A-4553.

Male domestic medium hair
This 3-month-old male domestic medium hair has a gray coat.
He is in cat room kennel No. 60b, ID No. LCAC-A-4552.

‘Halo’
“Halo” is a 3-year-old male domestic shorthair cat with a gray tabby coat.
He is in kennel No. 77a, ID No. LCAC-A-4466.

‘Wednesday’
“Wednesday” is a 3-year-old female domestic shorthair cat with a gray tabby coat.
She is in kennel No. 77b, ID No. LCAC-A-4463.

Female domestic medium hair
This 1-year-old female domestic medium hair cat has a gray coat.
She is in cat room kennel No. 107a, ID No. LCAC-A-4558.

Female Siamese kitten
This 3-month-old female Siamese kitten has a medium length white coat and blue eyes.
She is in cat room kennel No. 107b, ID No. LCAC-A-4554.

Male Siamese cat
This 2-year-old male Siamese cat has a white coat and blue eyes.
He is in cat room kennel No. A118, ID No. LCAC-A-4557.
Email Elizabeth Larson at