 How to resolve AdBlock issue?
News

LAKEPORT, Calif. — The Ladies of the Lake Quilt Guild has announced its highly anticipated annual Falling Leaves Quilt Show, inviting quilters and textile enthusiasts from near and far to showcase their exquisite craftsmanship.
The Falling Leaves Quilt Show will take place at the Lake County Fairgrounds at 401 Martin St. in Lakeport.
Show hours are Saturday, Oct. 7, from 10 a.m. to 5 p.m., and Sunday, Oct. 8, from 10 a.m. to 4 p.m.
Celebrating the timeless artistry of fabric, this event promises to captivate audiences with a mesmerizing display of colors, patterns, and stories woven into each unique quilt.
The annual quilt show has become a cherished tradition, offering a platform for talented quilters of all levels to exhibit their creative masterpieces and share their passion for the textile arts.
Whether you're an experienced quilter or just starting your journey, you are welcome to participate in this vibrant community event.
All quilt enthusiasts are invited to submit their extraordinary works of art for consideration in the Falling Leaves Quilt Show.
This year, the quilt guild is seeking a diverse range of quilts that highlight the rich tapestry of talent and creativity within our quilting community.

From traditional designs to modern interpretations, from hand-stitched heirlooms to innovative machine-made marvels, every quilt has a story to tell and a place in this showcase of textile artistry.
The deadline for submission is Aug. 13.
The event is open to quilters of all levels, including individuals, groups, and organizations. The entry fee is $8 per judged item and $1 per non-judged item. Prizes may be awarded in various categories
The Falling Leaves Quilt Show will be a feast for the eyes, providing visitors with an opportunity to immerse themselves in the world of quilting, gain inspiration, and appreciate the talent and dedication of our quilt-making community.
It's an occasion for quilters to connect, exchange ideas, and foster a supportive environment that celebrates the artistry and heritage of quilting.
To submit your quilt or for more information, visit www.llpg.org.
Don't miss this chance to have your quilt displayed and admired by fellow enthusiasts, patrons and art connoisseurs.
Ladies of the Lake Quilt Guild is a nonprofit organization dedicated to promoting and preserving the art of quilting in our community.

The researchers found that the number of emergency departments, or EDs, decreased by nearly 4% in California, while the number of ED visits rose by 7.4%.
It is the first analysis of emergency medicine patterns in recent years.
The researchers also reported that the number of high-severity visits rose by nearly 68%, while the number of low-severity visits declined by 63 percent.
“We know that there is overcrowding in the ED,” said lead author Renee Y. Hsia, MD, a UCSF professor of emergency medicine. “Capacity has largely failed to match the rise in patient demand.”
The paper published June 22, 2023 in JAMA Network Open.
Amid numerous changes in the U.S. health care system in recent years, emergency departments continue to play a vital role in the system. EDs are required to treat all patients regardless of ability to pay, and they function as a safety net for uninsured patients, many of whom use the ED for primary care services.
The new study used data from the California Department of Health Care Access and Information and the U.S. Census Bureau from January 1, 2011, to December 31, 2021.
In that time, California’s population grew by 4.2%, but the number of emergency departments in California fell from 339 to 326, while the number of hospital beds decreased by 2.5% (75,940 to 74,052).
“Our findings show what many health care workers already know to be true: the burden on emergency departments across the state of California has intensified over the last 10 to15 years,” Hsia said.
“Becoming aware of these trends is the first step to improving emergency department care,” she said. “To efficiently and equitably address ED crowding and improve overall care, policymakers and health care administrators should work to increase ED capacity, while also making thoughtful decisions about where and how to best allocate resources.”
Co-authors: From UCSF: Renee Y. Hsia, MD, MSc; Stefany Zagorov; Michael T. Savides; Madeline Feldmeier; and Newton Addo. From the National Bureau of Economic Research: Nandita Sarkar, PhD.
Elizabeth Fernandez writes for UC San Francisco.
The control burn, weather permitting, will take place from 8 a.m. to noon Saturday, July 8.
It will take place near the area of Larrecou Lane and Lakeport Blvd.
Community members are advised that they should expect to see smoke.
If possible, people are asked to avoid the area during the burn.
For more information, call the Lakeport Fire Protection District at 707-263-4396.
The information contained in the reports reflects statistics for 2022 as submitted by California law enforcement agencies and other criminal justice entities.
The reports provide policymakers, researchers, law enforcement, and members of the public with vital statewide information on criminal justice statistics in California to support informed policy choices based on data and analysis and help protect the safety and well-being of all Californians.
This year, in accordance with Assembly Bill 1191 (D-McCarty), the California Department of Justice, or DOJ, has released the first annual Crime Gun in California Report, which provides insights on patterns and trends relating to recovered firearms that have been illegally possessed, used in a crime, or suspected to have been used in a crime.
“Having access to good data is a cornerstone of responsible public policy. The data released today is essential for understanding, preventing, and combating crime,” said Bonta. “In 2022, California made significant progress towards reducing its homicide rates, but more remains to be done. While crime rates remain significantly below their historical highs, property and violent crimes continue to have devastating consequences for communities across the state, and gun violence remains a major threat to public safety.”
Bonta continued, “Despite having a gun death rate significantly below the national average, gun violence accounted for nearly three-fourths of all homicides in California in 2022. That is unacceptable. My office is committed to confronting these crimes head-on by holding law-breakers accountable, providing victims the resources they need to heal, and working proactively to prevent crime from happening in the first place.”
Each year, DOJ publishes annual reports on various criminal justice statistics in California. While law enforcement agencies across the state are in the process of transitioning to the new data collection system known as the California Incident-Based Reporting System, or CIBRS, the format of the information made available in this year’s reports remains consistent with previous years.
The ongoing transition to incident-based reporting will ultimately enable law enforcement agencies to collect more in-depth information about specific incidents than previously available in the legacy system that had been in use for decades.
For instance, under the legacy system, statistical data was typically collected using the “Hierarchy Rule,” i.e., only the most serious offense within a criminal incident is counted for statistical purposes. As a result, if a robbery and a homicide occurred in the same incident, the legacy system only counts the homicide for statistical reporting purposes.
Through CIBRS, policymakers, law enforcement, and members of the public will eventually have more detailed information, context, and specificity about crime in the state. Law enforcement agencies across California are currently in the process of transitioning to CIBRS.
To date, more than 600 reporting agencies have completed the transition and are in the process of becoming certified by DOJ. DOJ continues to work with agencies across the state during this ongoing transition.
In the interim, in order to help ensure the annual criminal justice reports remain complete and accurate to the fullest extent possible, DOJ continues to accept data in both the legacy and CIBRS formats.
The information made available in this year’s reports is a combination of data collected under both reporting methods.
Attorney General Bonta encourages researchers, academics, and all members of the public to analyze the data and use it to help inform public discourse on the state’s criminal justice system.
Key findings from each of the four reports released by Bonta and a brief description of their contents are available below:
Homicide in California 2022 provides information about the crime of homicide, including demographic data of victims, persons arrested for homicide, persons sentenced to death, peace officers feloniously killed in the line of duty, and justifiable homicides. Some of the key findings include:
• The homicide rate, defined as the number of homicides per 100,000 people in the state, decreased 5 percent in 2022 (from 6 per 100,000 in 2021 to 5.7 per 100,000 in 2022), remaining significantly below California’s historical high of 12.9 per 100,000 in 1993. The number of homicides in 2022 remains roughly half of the number of homicides in 1993, despite the population swelling from approximately 31 million in 1993 to more than 39 million in 2022.
• Firearms continue to be the most common weapon used in homicides. In 2022, 73.6% of homicides, where the weapon was identified, involved a firearm.
• Among California’s 36 counties with populations of 100,000 or more, Merced County experienced the highest reported homicide rate (12.3 per 100,000) and Santa Cruz County, the lowest (0.8 per 100,000).
• Among homicides where the victim’s relationship to the suspect was identified, females (37.1%) were more likely than males (7.7%) to be killed by their spouse, parent, or child.
• There was a 4.2% decrease in total homicide arrests from 1,550 in 2021 to 1,485 in 2022.
Crime in California 2022 presents statewide statistics for reported crimes, arrests, dispositions of adult felony arrests, adult probation, criminal justice personnel, civilians’ complaints against peace officers, domestic violence-related calls for assistance, anti-reproductive-rights crimes, and law enforcement officers killed or assaulted. Some of the key findings include:
• The violent crime rate — i.e., the number of violent crimes per 100,000 people — increased 6.1% from 466.2 in 2021 to 494.6 in 2022, remaining significantly below California’s historical high of 1,103.9 in 1992.
• The property crime rate increased 6.2% from 2,178.4 in 2021 to 2,313.6 in 2022, remaining significantly below California’s historical high of 6,880.6 in 1980.
• The total arrest rate decreased 2.7% from 2,606.3 in 2021 to 2,535.2 in 2022, continuing an ongoing year-to-year downward trend that began in 2004 when the total arrest rate was 5,385.5.
In 2022, the total number of adults on active probation reached its lowest level since 1980 at 151,402.
• The total number of full-time criminal justice personnel — including law enforcement, prosecutors, investigators, public defenders, and probation officers — decreased 1.4%. From 2021 to 2022, the number of law enforcement, prosecution and probation personnel decreased 1.3, 0.3 and 3.6 percent, respectively.
Use of Force Incident Reporting 2021 presents a summary overview of use of force and discharge-of-firearm incidents involving a peace officer, as defined in California Government Code section 12525.2. Some of the key findings include:
• In 2022, there were 597 incidents that involved the use of force resulting in serious bodily injury or death of a civilian or officer, or the discharge of a firearm. Of those incidents:
49.4% occurred during a call for service.
16.1% occurred while either a crime was in progress or while officers were investigating suspicious persons or circumstances.
74.9% resulted from a vehicle, bike, or pedestrian stop.
In 2022, 612 civilians were involved in incidents that involved the discharge of a firearm or use of force resulting in serious bodily injury or death. Of those civilians:
48.4% were Hispanic.
25.3% were white.
19.3% were black.
• In 2022, 1,375 officers were involved in incidents that involved the discharge of a firearm or use of force resulting in serious bodily injury or death. Of those officers:
82.5% were not injured.
17.1% were injured.
0.3% died.
Juvenile Justice in California 2022 provides insight into the juvenile justice process by reporting the number of arrests, referrals to probation departments, petitions filed, and dispositions for juveniles tried in juvenile and adult courts. Some of the key findings include:
• Of the 36,640 referrals of juveniles to probation, 94.5% were referred by law enforcement.
Of the 26,000 juvenile arrests:
45.8% were for a felony offense.
49.8% were for a misdemeanor offense.
4.4% were for a status offense, defined as acts that would not be classified as crimes if committed by adults.
• Of those same juveniles:
62.5% were referred to probation.
20.6% were counseled and released.
16.9% were turned over to another agency.
Of the 17,627 juvenile cases that were formally handled by a juvenile court, 51.3% resulted in juveniles being made wards of the court.
• Of the 59 juvenile cases tried in adult court, 71.2% resulted in a conviction.
Crime Guns in California 2022 provides insight into patterns and trends relating to recovered firearms that have been illegally possessed, used in a crime, or suspected to have been used in a crime — also known as “crime guns”— including the leading sources and origins of those firearms. Some of the other key findings include:
• Approximately 545,946 unique crime guns with identifiable serial numbers were recovered by law enforcement agencies in California and entered in the Automated Firearm System (AFS) between January 1, 2010 and December 31, 2022. Additionally, approximately 85,402 crime guns were entered in AFS without any recorded serial number over this period.
• 76,135 (13.94%) of the serialized crime guns entered in AFS over this period could be associated with a total of 1,929 distinct California firearm dealers.
• While all the identified dealers sold or transferred at least one firearm that was later recovered as a crime gun, 344 dealers were associated with only one crime gun and 82 dealers were associated with roughly half of all crime guns (38,230 firearms). The highest number of crime guns associated with one dealer was 1,652.
• On average, each licensed dealer sold or transferred 39 firearms that were later identified as a crime gun.
• The manufacturers associated with the most crime gun records included: Smith & Wesson; Glock; Sturm, Ruger, & Co.; Taurus Forjas; and Remington.
• Crime guns were recovered by law enforcement in all 58 counties.
• Counties with higher populations tended to have higher numbers of crime guns. However, when accounting for crime guns per capita, a county’s population size did not appear to have any reliable correlation with its number of crime guns per person. In other words, more populous areas, like cities, were not necessarily more likely to recover more or fewer crime guns per capita than less populous area.
• Over the past decade, California experienced a significant increase in the number of crime guns recovered without serial numbers. In 2022, there was a 7% drop in the number of crime guns without serial numbers reported statewide, the first decrease recorded since 2013.
The Homicide in California report is available here. The Crime in California report is available here. The Use of Force Incident Reporting report is available here. The Juvenile Justice in California report is available here. The Crime Guns in California Report is available here. The underlying data associated with the annual reports is available on OpenJustice here.
The council will meet at 6 p.m. Thursday, July 6, for a budget workshop before the regular meeting begins at 6 p.m. in the council chambers at Clearlake City Hall, 14050 Olympic Drive.
The meeting will be broadcast live on the city's YouTube channel or the Lake County PEGTV YouTube Channel. Community members also can participate via Zoom or can attend in person. The webinar ID is 878 6022 4577.
One tap mobile is available at +16694449171,,87860224577# or join by phone at 669 444 9171 or 720 707 2699.
The agenda can be found here.
Comments and questions can be submitted in writing for City Council consideration by sending them to City Clerk Melissa Swanson at
To give the council adequate time to review your questions and comments, please submit your written comments before 4 p.m. Thursday, July 6.
Under business items, staff will present the annual financial report and single audit report for fiscal year 2021-22.
The council also will consider approving the lease with Peterson/CAT in the amount of $208,814.37.
In other business, the council will consider updates to the management classification and benefits plan and city salary. Those proposed updates include a 3% cost of living increase.
On the meeting's consent agenda — items that are considered routine in nature and usually adopted on a single vote — are warrants; consideration of rejection of proposals for design services of the dam road roundabout; approval of contract amendment with Lucy & Co. for public relations and communication; approval of contribution to Hands Up Lake County for support of the 1 Team 1 Dream Program in the amount of $30,000; approval of additional leave of absence without pay for Maintenance Worker II Johnny Miskill for June 8, 2023 through June 18, 2023; consideration of bid award for the City Hall Remodel Project to Adams Commercial General Contracting Inc. in the amount of $1,281,110 and authorize the city manager to approve change orders up to 10% of the contract price; authorization of purchase of office furniture from National Business Furniture through the GSA Program in an amount not to exceed $70,000; and authorization of a side letter with the Clearlake Police Officer Association and the Clearlake Middle Management Association.
Email Elizabeth Larson at
Over the past two decades, a staggering 21.8 million Americans found themselves living within 3 miles (5 kilometers) of a large wildfire. Most of those residents would have had to evacuate, and many would have been exposed to smoke and emotional trauma from the fire.
Nearly 600,000 of them were directly exposed to the fire, with their homes inside the wildfire perimeter.
Those statistics reflect how the number of people directly exposed to wildfires more than doubled from 2000 to 2019, my team’s new research shows.
But while commentators often blame the rising risk on homebuilders pushing deeper into the wildland areas, we found that the population growth in these high-risk areas explained only a small part of the increase in the number of people who were exposed to wildfires.
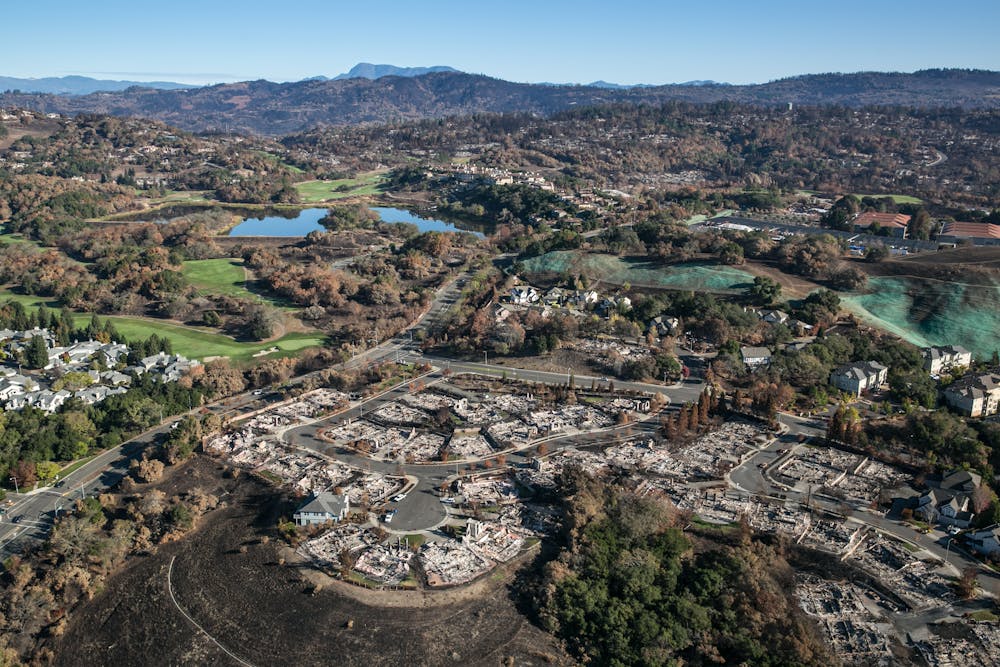
Instead, three-quarters of this trend was driven by intense fires growing out of control and encroaching on existing communities.
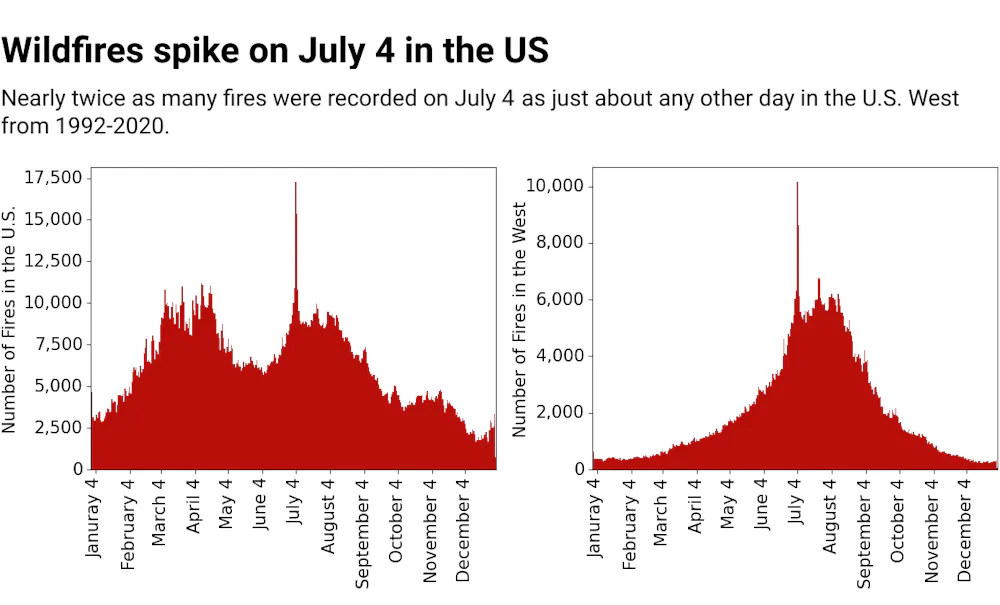
That knowledge has implications for how communities prepare to fight wildfires in the future, how they respond to population growth and whether policy changes such as increasing insurance premiums to reduce losses will be effective. It’s also a reminder of what’s at risk from human activities, such as fireworks on July 4, a day when wildfire ignitions spike.
Where wildfire exposure was highest
I am a climate scientist who studies the wildfire-climate relationship and its socioenvironmental impacts. For the new study, colleagues and I analyzed the annual boundaries of more than 15,000 large wildfires across the Lower 48 states and annual population distribution data to estimate the number of people exposed to those fires.
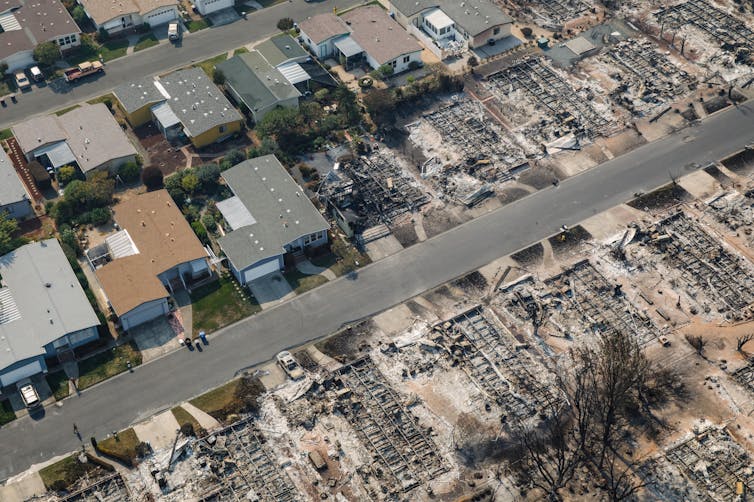
Not every home within a wildfire boundary burns. If you picture wildfire photos taken from a plane, fires generally burn in patches rather than as a wall of flame, and pockets of homes survive.
We found that 80% of the human exposure to wildfires – involving people living within a wildfire boundary from 2000 to 2019 – was in Western states.
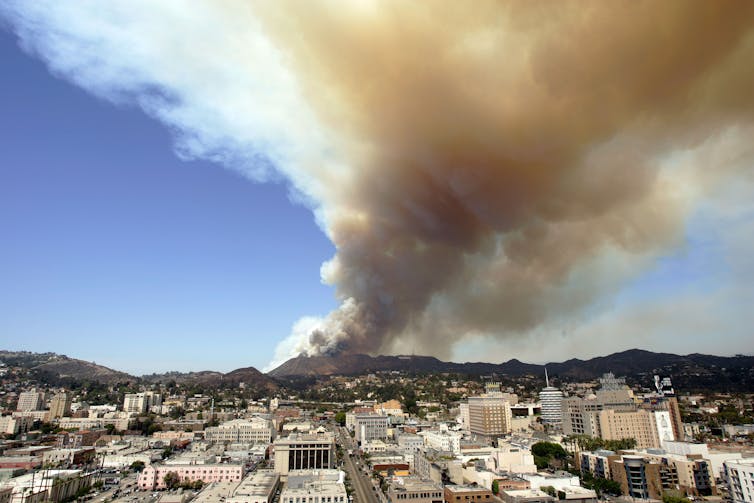
California stood out in our analysis. More than 70% of Americans directly exposed to wildfires were in California, but only 15% of the area burned was there.
What climate change has to do with wildfires
Hot, dry weather pulls moisture from plants and soil, leaving dry fuel that can easily burn. On a windy day – such as California often sees during its hottest, driest months – a spark, for example from a power line, campfire or lightning, can start a wildfire that quickly spreads.
Recent research published in June 2023 shows that almost all of the increase in California’s burned area in recent decades has been due to anthropogenic climate change – meaning climate change caused by humans.
Our new research looked beyond just the area burned and asked: Where were people exposed to wildfires, and why?
We found that while the population has grown in the wildland-urban interface, where houses intermingle with forests, shrublands or grasslands, that accounted for only about one-quarter of the increase in the number of humans directly exposed to wildfires across the Lower 48 states from 2000 to 2019.
Three-quarters of that 125% increase in exposure was due to fires’ increasingly encroaching on existing communities. The total burned area increased only 38%, but the locations of intense fires near towns and cities put lives at risk.
In California, which was in drought during much of that period, several wildfire catastrophes hit communities that had existed long before 2000. Almost all these catastrophes occurred during dry, hot, windy conditions that have become increasingly frequent because of climate change.
Wildfires in the high mountains in recent decades provide another way to look at the role that rising temperatures play in increasing fire activity.
High mountain forests have few cars, homes and power lines that could spark fires, and humans have historically done little to clear brush there or fight fires that could interfere with natural fire regimes. These regions were long considered too wet and cool to regularly burn. Yet my team’s past research showed fires have been burning there at unprecedented rates in recent years, mainly because of warming and drying trends in the Western U.S.
What can communities do to lower the risk?
Wildfire risk isn’t slowing. Studies have shown that even in conservative scenarios, the amount of area that burns in Western wildfires is projected to grow in the next few decades.
How much these fires grow and how intense they become depends largely on warming trends. Reducing emissions will help slow warming, but the risk is already high. Communities will have to both adapt to more wildfires and take steps to mitigate their impacts.
Developing community-level wildfire response plans, reducing human ignitions of wildfires and improving zoning and building codes can help prevent fires from becoming destructive. Building wildfire shelters in remote communities and ensuring resources are available to the most vulnerable people are also necessary to lessen the adverse societal impacts of wildfires.![]()
Mojtaba Sadegh, Associate Professor of Civil Engineering, Boise State University
This article is republished from The Conversation under a Creative Commons license. Read the original article.