 How to resolve AdBlock issue?
News
Every two minutes, in about the time it takes to read a page of your favorite book or brew a cup of coffee, a woman dies during pregnancy or childbirth, according to a February 2023 report from the World Health Organization. The report reflects a shameful reality in which maternal deaths have either increased or plateaued worldwide between 2016 and 2020.
On top of that, of every 10 babies born, one is preterm – and every 40 seconds, one of those babies dies. Globally, preterm birth is the leading cause of death in children under the age of 5, with complications from preterm birth resulting in the death of 1 million children under age 5 each year.
The WHO has designated preterm birth an “urgent public health issue” in recognition of the threat it poses to global health.
Those numbers reflect a worldwide problem, but the U.S. in particular has an abysmal record on both preterm births and maternal mortality: Despite significant medical advancements in recent years, the U.S. suffers from the highest maternal mortality rate among high-income countries globally. And the 2022 March of Dimes Report Card, an evaluation of maternal and infant health, gave the United States an extremely poor “D+” grade. That data also revealed that the national preterm birth rate spiked to 10.5% in 2021, representing a record 15-year high.
We are maternal fetal medicine experts and scholars of women’s health who focus on treatments and programs to help women have better maternal health, especially those that reduce preterm birth.
Our Office of Women’s Health leads the SOS Maternity Network, which stands for the Synergy of Scholars in Maternal and Infant Health Equity, a research alliance of maternal fetal medicine physicians across the state of Michigan.
Maternal and infant death are the worst possible outcomes of pregnancy. These numbers make clear just how crucial it is to change this trajectory and to ensure all Americans have practical access to quality reproductive health care.
Dire state of maternal health care
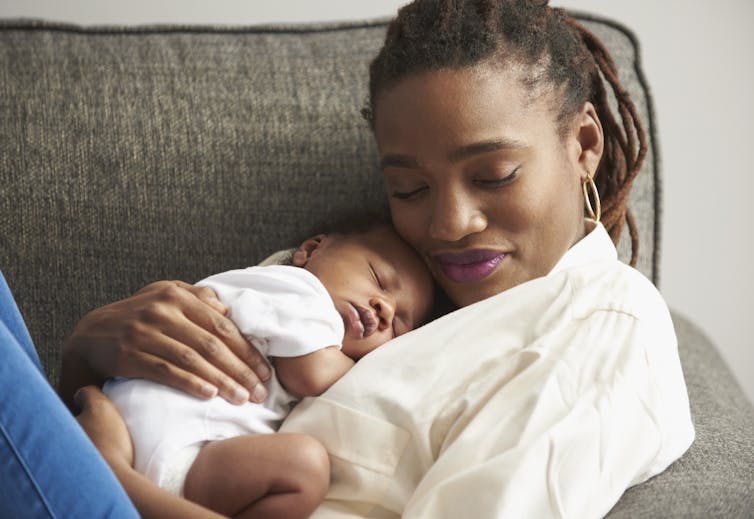
Tori Bowie, an elite Olympic athlete, tragically lost her life at just age 32 because of complications of pregnancy and childbirth.
Bowie’s story drives home the devastating state of maternal health in the U.S. Maternal mortality is a sad and unexpected ending to the often beautiful journey of pregnancy and childbirth. It means that a baby has to go without its mother’s love, care and comforting touch and at the same time the family has to mourn the sudden loss of their loved one. Unless substantial progress is made for lowering maternal deaths, the lives of over 1 million more women like Bowie could be at risk by the year 2030, if current trends continue.
Unfortunately, the maternal and infant health crises are worsening in the U.S., and this association is far from being an unfortunate coincidence. There is an important link between infant health and maternal health, as they both rely on the accessibility and quality of health care. These U.S. rates have been increasing since 2018, when improved reporting of maternal deaths was adopted.
In 2020, the U.S. maternal mortality rate was 23.8 deaths per 100,000 live births – nearly three times as high as the country with the next-highest rate of 8.7 deaths per 100,000 live births, France.
The number of women who died within a year after pregnancy more than doubled in the U.S. over the 20-year period of 1999 to 2019. And there are significant racial disparities in this statistic: The highest number of pregnancy-related deaths were recorded among Black women, increasing from 26.7 per 100,000 births to 55.4 per 100,000 during that same time period.
Worse yet, the Centers for Disease Control and Prevention has determined that about 84% of such maternal deaths are preventable.
Tragic rates of infant mortality and preterm birth
Notably, in 2020 the U.S. also experienced the highest infant mortality rate of all high-income countries. The U.S infant mortality rate was 5.4 deaths per 1,000 live births, in contrast to the 1.6 deaths per 1,000 live births in Norway, the country with the lowest infant mortality rate.
You may have heard the term “preemie” before, perhaps when a loved one delivered a baby more than three weeks before the expected due date. A premature birth is one that occurs before the 37th week of pregnancy. Preterm-related causes are responsible for 35.8% of infant deaths in the U.S.
Preterm babies are often not fully physiologically prepared for delivery, which can result in a range of medical complications. While preterm births lead to rising infant mortality rates, even those who survive can face health problems such as breathing difficulties, problems with feeding, significant developmental delay and more throughout their lives. Preterm birth also presents additional risks for the mother, as women who deliver preterm are at higher risk for cardiovascular complications later in life.
Thus, preterm birth takes a significant toll on families and their communities, with serious ramifications in medical, social, psychological and financial contexts.
Maternal care during pregnancy is key
Maternal care appointments and screenings are essential to prevent prenatal complications and a women’s increased risk for developing long-term complications such as cardiovascular disease. For that reason, patients should secure prenatal care as early as possible in the pregnancy and continue to regularly have prenatal care appointments.
Preterm birth can occur unexpectedly in an otherwise normal-seeming pregnancy. It looks no different from the early signs of a typical labor, except that it occurs before 37 weeks of pregnancy. The symptoms of premature labor can include contractions, unusual vaginal discharge, the feeling of pressure in the pelvic area, low dull backache or cramps in the uterus or abdomen. A person who experiences these symptoms during pregnancy should seek medical attention.
Some people are more predisposed to preterm birth based on individual risk factors like substance use, multiple pregnancy – such as twins – infections, race, a medical history of prior preterm delivery and heightened stress levels. Our research team and others have shown that COVID-19 is a known risk factor for preterm birth.
It’s important to speak with your primary care provider to assess how your current health may affect future pregnancy and whether lifestyle changes – such as adopting a healthy diet and active lifestyle and avoiding smoking and drinking alcohol – can improve your likelihood of a full-term delivery.
Preterm birth prevention
The more that pregnant women take ownership of their health and ask their doctors to perform a simple cervical length screening during their pregnancy, the earlier preterm birth can be detected and prevented and the more lives will be saved.
Evidence has shown that patients with a short cervix face a greater risk of the cervix’s opening too early in pregnancy, resulting in preterm birth and other adverse outcomes. The cervix is the lower section of the uterus, which connects to the vaginal canal. As pregnancy progresses, it stretches, softens and ultimately opens in the process of normal childbirth.
All patients – even those who are seemingly low risk – should ask their doctors to have their cervical length checked by transvaginal ultrasound during pregnancy between 19 and 24 weeks. A short cervical length indicates a high risk of a premature delivery. Luckily, there are treatments available, such as vaginal progesterone, which can prevent preterm birth in women found by ultrasound to have a short cervix. This treatment can reduce the risk of preterm birth by more than 40%.
We are optimistic that with greater awareness of these issues and a shift in the focus to evidence-based practices coupled with increased access to vulnerable populations, the U.S. can begin to give women like Bowie and so many others the health care they and their infants deserve.
This article has been updated to highlight the most recent trends in maternal mortality that were reported on July 3, 2023, and to highlight the stark racial disparities.![]()
Sonia Hassan, Professor of Obstetrics and Gynecology and Maternal Fetal Medicine, Wayne State University and Hala Ouweini, Research Associate in Women's Health, Wayne State University
This article is republished from The Conversation under a Creative Commons license. Read the original article.
The U.S. homeownership rate in 2022 was even higher than before the COVID-19 pandemic — 65.8% compared to 64.6% in 2019 — a rebound driven largely by those age 44 and younger, according to the Census Bureau’s Current Population Survey/Housing Vacancy Survey (CPS/HVS).
Homeownership continued to climb from the downturn following the foreclosure crisis (2004) and Great Recession (2008), when rates dipped as low as 63.4% in 2016. Homeownership rates recovered approximately half of the 5.6% decrease from 2004 to 2016.
The recovery began before the pandemic hit the United States in March 2020: rates rose 1.2 points from 2016 to 2019, and by another 1.2 points from 2019 to 2022.
The pandemic disrupted CPS/HVS data collection operations in 2020 and part of 2021. As a result, it is difficult to know whether the homeownership rate grew during each year of the pandemic.
To account for the disruption, this article focuses on homeownership rate changes from the low in 2016; the 2019 pre-pandemic rate; and the rate in 2022 (when data collection returned to normal).
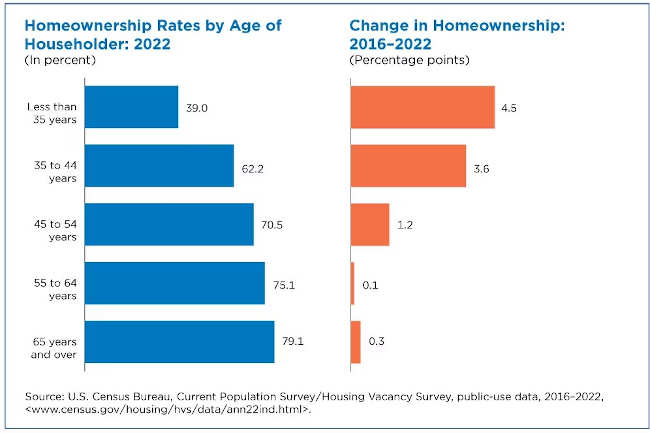
Younger households typically are more likely to rent than own homes. Yet from 2016 to 2022, homeownership among adults under age 55 went up but remained stable among older populations.
From 2016 to 2019, homeownership increased among householders under age 35 (up 2.2 percentage points), ages 35 to 44 (up 1.5 points), and 45 to 54 (up 0.8 points). The increases for the 35 to 44 age group were not statistically different from the youngest and the oldest age groups.
Rates among older householders were not statistically different during the same period.
The pattern was similar from 2019 to 2022 when homeownership rates also rose about 2% among householders under age 35 and between ages 35 and 44, with one exception: the rate also inched up (0.5 percentage points) among those age 65 and over. There was no statistically significant change among householders in other age groups.
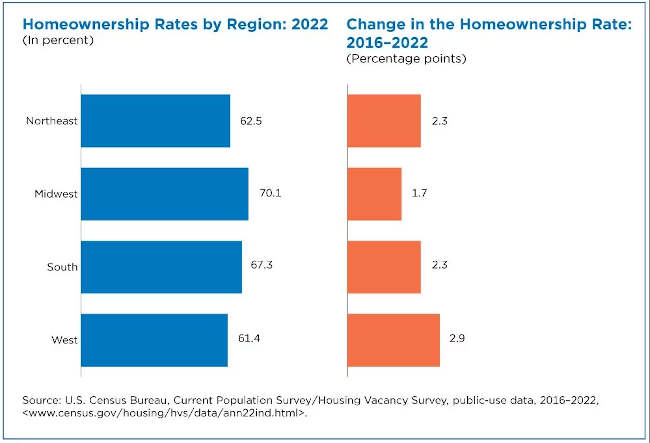
Homeownership rates rose in the Northeast, South and West from 2016 to 2019, and in all regions from 2019 to 2022.
Low mortgage rates likely helped drive the rise, even after rates began to go up in 2022.
By 2022, the homeownership rate in the Midwest hit 70%, the highest of all regions. The South had the second-highest homeownership rate (67.3%), followed by two regions that were not statistically different: the Northeast (62.5%) and West (61.4%).
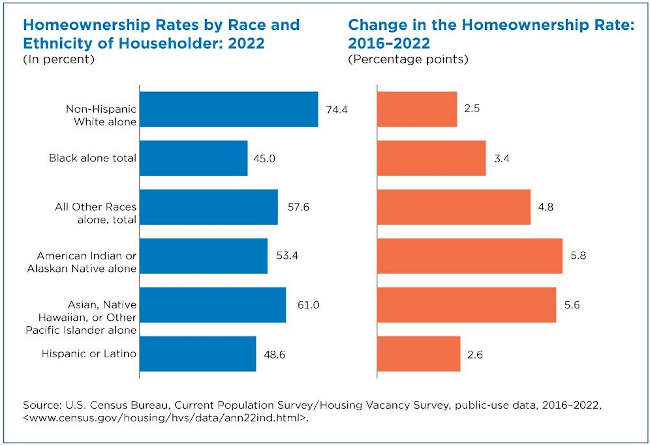
Homeownership rates rose from 2016 to 2019 among non-Hispanic White householders, Asian, and Native Hawaiian, or Other Pacific Islander householders. There was no increase among Black or American Indian/Alaskan Native householders.
But from 2019 to 2022, homeownership rates increased among householders of all races and ethnicities except for American Indian or Alaskan Native householders.
The share of non-Hispanic White householders who owned a home grew from 71.9% in 2016 to 74.4% in 2022. There was about a 3-point increase for Black alone householders (45%) and about a 6-point increase for American Indian or Alaska Native householders (53.4%) and Asian, Native Hawaiian, or Other Pacific Islander householders (61.0%).
There was no significant difference in the increases for non-Hispanic white householders compared to Black alone, American Indian or Alaska Native, or Hispanic householders.
The difference was also not significant for Black householders compared to American Indian or Alaska Native or Hispanic householders, or for American Indian or Alaska Native versus Asian, Native Hawaiian, or Other Pacific Islander or Hispanic householders.
About the CPS/HVS
Each annual CPS/HVS release includes more detailed information about homeownership rates by region, age of householder, and race/ethnicity of householder. It also includes overall homeownership estimates for the 50 states and the District of Columbia and the 75 largest metropolitan statistical areas.
In addition, it provides characteristics of vacant housing units for rent and for sale at the national and regional levels, as well as rental and homeowner vacancy rates.
More information on confidentiality protection, methodology, sampling and nonsampling error, and definitions is available in this document.
Robert R. Callis is a survey statistician in the Census Bureau’s Social, Economic, and Housing Statistics Division.
The state of California’s COVID-19 dashboard showed this week that case numbers began going up earlier this summer and are still on the rise.
The latest numbers for the state, reported through Aug. 3, show California’s testing positivity rate is 8.7%.
Lake County’s positivity rate is 15.2%, down by half a percentage point from the previous week.
State tracking of Lake County’s positivity rate showed that it started to spike in June, dropped in July and then began to rise to its highest levels since the previous June.
The current positivity rate is higher than rates seen in December, which were below 10%.
For comparison, Lake County’s seven-day positivity rate reached its highest point in the pandemic in January 2022, when it hit 25.7%.
State tracking shows that Lake County has typically had two main case spikes a year, one in the summer, beginning in June, and a second, stretching from December to February.
One Lake County resident was reported to be hospitalized due to the coronavirus as of Aug. 3, while there are a total of 906 hospitalized across California.
The state reported that Lake County has had a total of 168 deaths attributed to COVID-19, which is 19 deaths since the start of the year, according to Lake County News’ tracking of virus-related deaths.
The number of deaths statewide is 103,054.
To date, 195,401 total tests performed in Lake County while 202,230,035 have been performed statewide.
Email Elizabeth Larson at
The first day of the 2023-24 school year for the Lakeport Unified School District is Tuesday, Aug. 8.
The Lakeport Police Department said for motorists to drive with great caution as there will be an increase in vehicles and pedestrians. Police also will step up enforcement.
Drivers are urged to obey all traffic rules and regulations in and around the campus.
Officers will be in the area during the first few weeks conducting education and enforcement.
The district asked that If you are visiting your Lakeport Tiger, Terrace Viking or Clear Lake Cardinal outside of drop-off or pick-up times, please check in with the appropriate office staff for a visitor pass. The campus is a tobacco, alcohol, and drug-free zone.
“We thank you in advance for your patience and cooperation as we continue to work towards ensuring a campus environment that is a safe and conducive learning environment,” the district reported.
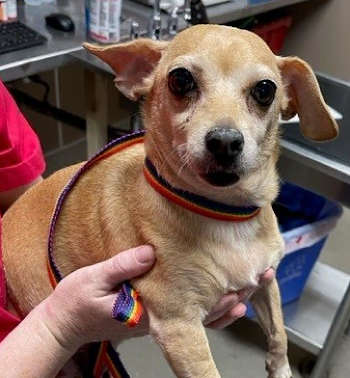
Dogs available for adoption this week include mixes of Anatolian shepherd, Belgian malinois, Chihuahua, collie, German shepherd, hound, mastiff, pit bull and terrier.
Dogs that are adopted from Lake County Animal Care and Control are either neutered or spayed, microchipped and, if old enough, given a rabies shot and county license before being released to their new owner. License fees do not apply to residents of the cities of Lakeport or Clearlake.
The following dogs at the Lake County Animal Care and Control shelter have been cleared for adoption.
Call Lake County Animal Care and Control at 707-263-0278 or visit the shelter online for information on visiting or adopting.

‘Little Foot’
“Little Foot” is a 7-month-old male German shepherd puppy with a short black and tan coat.
He is in kennel No. 2, ID No. LCAC-A-5315.

Male Great Pyrenees
This 1 and a half year old male Great Pyrenees has a white coat.
He is in kennel No. 3, ID No. LCAC-A-5469.

Male poodle
This 2-year-old male poodle has a black coat.
He is in kennel No. 4, ID No. LCAC-A-5541.

Anatolian shepherd-mastiff mix
This 3-year-old male Anatolian shepherd-mastiff mix has a short fawn coat.
He is in kennel No. 5, ID No. LCAC-A-5276.

Male Chihuahua
This 5-year-old male Chihuahua has a short tricolor coat.
He is in kennel No. 6, ID No. LCAC-A-5500.

‘Roasie’
“Roasie”is a 2-year-old female pit bull terrier with a short black and white coat.
She is in kennel No. 7, ID No. LCAC-A-5434.

Female pit bull
This 3-year-old female pit bull has a short brown coat.
She is in kennel No. 8, ID No. LCAC-A-5505.

Female pit bull terrier
This 3-year-old female pit bull terrier has a brown and white coat.
She is in kennel No. 10, ID No. LCAC-A-5400.
Female Chihuahua
This 9-year-old female Chihuahua has a short brown and white coat.
She is in kennel No. 11, ID No. LCAC-A-5511.

Female German shepherd
This 2-year-old female German shepherd has a black and tan coat.
She is in kennel No. 12, ID No. LCAC-A-5488.

Male shepherd
This 2 and a half year old male shepherd has a short black and tan coat.
He is in kennel No. 14, ID No. LCAC-A-5479.

‘Zeta’
“Zeta” is a 1-year-old female pit bull terrier with a black and tan coat.
She is in kennel No. 16, ID No. LCAC-A-5427.

‘Jax’
“Jax” is a 4-year-old male Siberian husky with a black and white coat.
He is in kennel No. 17, ID No. LCAC-A-5477.

This 2-year-old male Chihuahua-terrier mix has a short white coat.
She is in kennel No. 20, ID No. LCAC-A-5381.

Male shepherd
This 2-year-old male shepherd has a black and tan coat.
He is in kennel No. 22, ID No. LCAC-A-5423.

Female pit bull terrier
This 6-year-old female pit bull terrier has a short tan coat.
She is in kennel No. 24, ID No. LCAC-A-5410.

Male shepherd
This 1 and a half year old male shepherd has a short tricolor coat.
He is in kennel No. 26, ID No. LCAC-A-5424.

Female shepherd
This 2-year-old female shepherd has a short yellow and white coat.
She is in kennel No. 27, ID No. LCAC-A-5369.

Female collie mix
This 3-year-old collie mix has a black coat.
She is in kennel No. 28, ID No. LCAC-A-5514.

‘Spot’
“Spot” is a 5-month-old male pit bull puppy with a white coat.
He is in kennel No. 29, ID No. LCAC-A-5325.

Male shepherd mix puppy
This 6-month-old male shepherd mix puppy has a black coat with white markings.
He is in kennel No. 32, ID No. LCAC-A-5408.

‘Nana’
“Nana” is a 2-year-old female shepherd mix with a short yellow coat.
She is in kennel No. 33, ID No. LCAC-A-5277.

Female shepherd
This 10-month-old female shepherd has a tricolor coat.
She is in kennel No. 34, ID No. LCAC-A-5323.

‘Jojo’
“Jojo” is a one and a half year old female pit bull terrier with a short tricolor coat.
She is in kennel foster care, ID No. LCAC-A-5312.
Email Elizabeth Larson at

A few years ago, I had the opportunity to go on safari in southern Africa. One of the greatest thrills was going out at night looking for predators on the prowl: lions, leopards, hyenas.
As we drove through the darkness, though, our spotlight occasionally lit up a smaller hunter – a slender, tawny feline, faintly spotted or striped. The glare would catch the small cat for a moment before it darted back into the shadows.
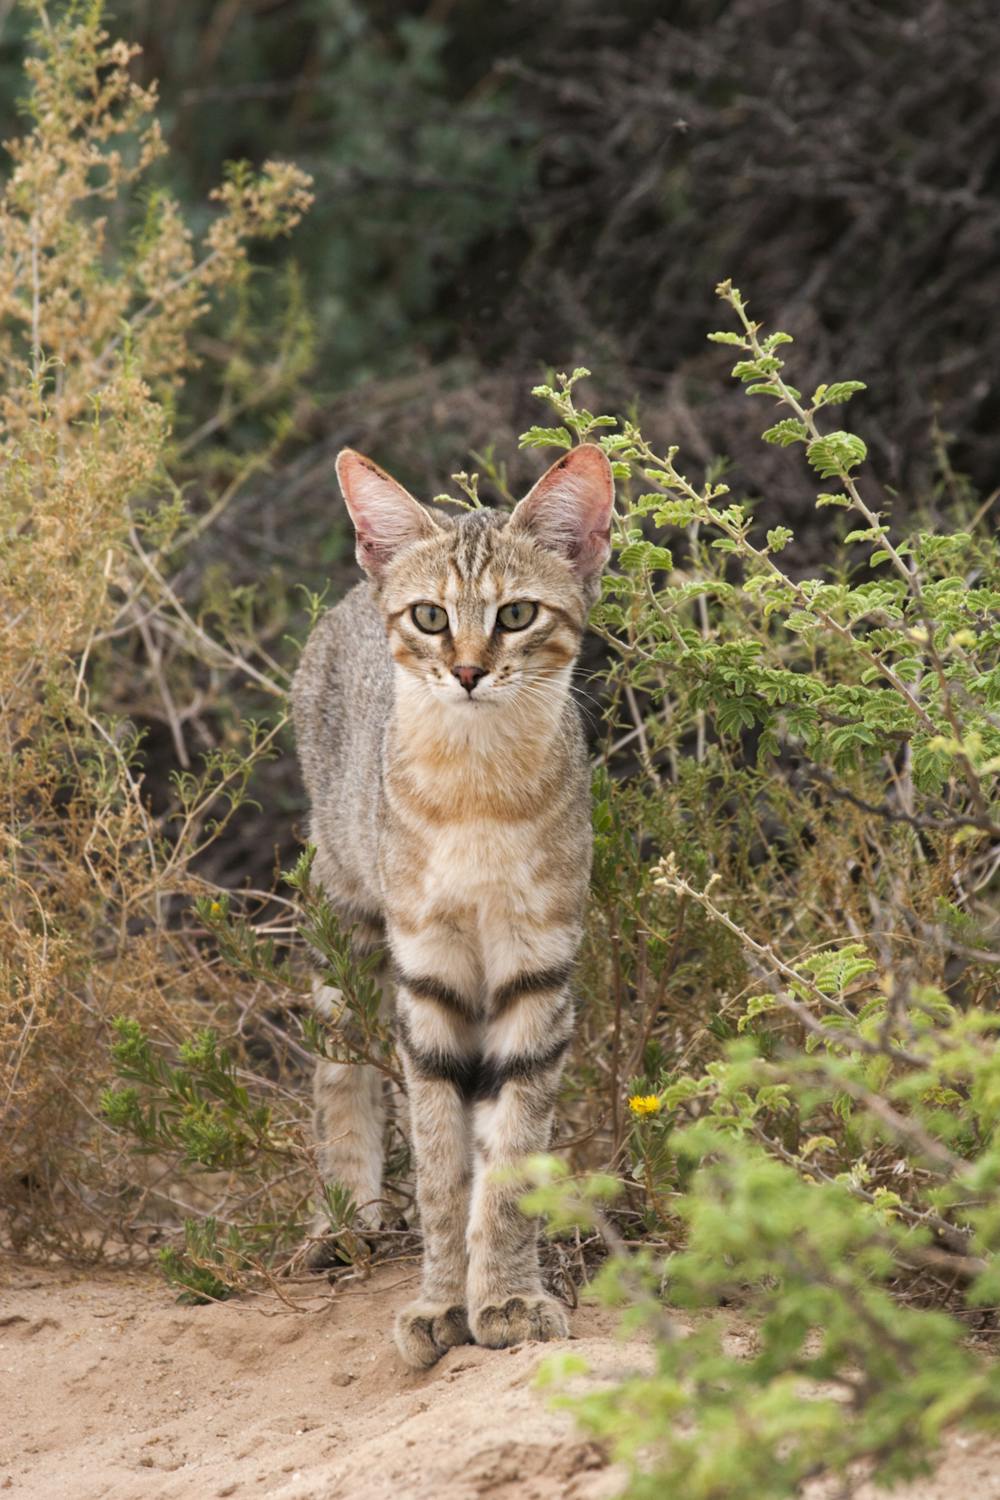
Based on its size and appearance, I initially presumed it was someone’s pet inexplicably out in the bush. But further scrutiny revealed distinctive features: legs slightly longer than those of most domestic cats, and a striking black-tipped tail. Still, if you saw one from your kitchen window, your first thought would be “Look at that beautiful cat in the backyard,” not “How’d that African wildcat get to New Jersey?”
As an evolutionary biologist, I’ve spent my career studying how species adapt to their environment. My research has been reptile-focused, investigating the workings of natural selection on lizards.
Yet, I’ve always loved and been fascinated by felines, ever since we adopted a shelter cat when I was 5 years old. And the more I’ve thought about those African wildcats, the more I’ve marveled at their evolutionary success. The species’ claim to fame is simple: The African wildcat is the ancestor of our beloved household pets. And despite changing very little, their descendants have become among the world’s two most popular companion animals. (Numbers are fuzzy, but the global population of cats and dogs approaches a billion for each.)
Clearly, the few evolutionary changes the domestic cat has made have been the right ones to wangle their way into people’s hearts and homes. How did they do it? I explored this question in my book “The Cat’s Meow: How Cats Evolved from the Savanna to Your Sofa.”
Why the African wildcat?
Big cats – like lions, tigers and pumas – are the attention-grabbing celebrities of the feline world. But of the 41 species of wild felines, the vast majority are about the size of a housecat. Few people have heard of the black-footed cat or the Borneo bay cat, much less the kodkod, oncilla or marbled cat. Clearly, the little-cat side of the feline family needs a better PR agent.
In theory, any of these species could have been the progenitor of the domestic cat, but recent DNA studies demonstrate unequivocally that today’s housecats arose from the African wildcat – specifically, the North African subspecies, Felis silvestris lybica.
Given the profusion of little pusses, why was the North African wildcat the one to give rise to our household companions?
In short, it was the right species in the right place at the right time. Civilization began in the Fertile Crescent about 10,000 years ago, when people first settled into villages and started growing food.
This area – spanning parts of modern-day Egypt, Turkey, Syria, Iran and more – is home to numerous small cats, including the caracal, serval, jungle cat and sand cat. But of these, the African wildcat is the one that to this day enters villages and can be found around humans.
African wildcats are among the friendliest of feline species; raised gently, they can make affectionate companions. In contrast, despite the most tender attention, their close relative the European wildcat grows up to be hellaciously mean.
Given these tendencies, it’s easy to envision what likely happened. People settled down and started raising crops, storing the excess for lean times. These granaries led to rodent population explosions. Some African wildcats – those with the least fear of humans – took advantage of this bounty and started hanging around. People saw the benefit of their presence and treated the cats kindly, perhaps giving them shelter or food. The boldest cats entered huts and perhaps allowed themselves to be petted – kittens are adorable! – and, voilà, the domestic cat was born.

Where exactly domestication occurred – if it was a single place and not simultaneously throughout the entire region – is unclear. But tomb paintings and sculptures show that by 3,500 years ago, domestic cats lived in Egypt. Genetic analysis – including DNA from Egyptian cat mummies – and archaeological data chart the feline diaspora. They moved northward through Europe (and ultimately to North America), south deeper into Africa and eastward to Asia. Ancient DNA even demonstrates that Vikings played a role in spreading felines far and wide.
What cat traits did domestication emphasize?
Domestic cats possess many colors, patterns and hair textures not seen in wildcats. Some cat breeds have distinctive physical features, like munchkins’ short legs, Siameses’ elongated faces or Persians’ lack of muzzle.

Yet many domestics appear basically indistinguishable from wildcats. In fact, only 13 genes have been changed by natural selection during the domestication process. By contrast, almost three times as many genes changed during the descent of dogs from wolves.
There are only two ways to indisputably identify a wildcat. You can measure the size of its brain – housecats, like other domestic animals, have evolved reductions in the parts of the brain associated with aggression, fear and overall reactivity. Or you can measure the length of its intestines – longer in domestic cats to digest vegetable-based food provided by or scavenged from humans.
The most significant evolutionary changes during cat domestication involve their behavior. The common view that domestic cats are aloof loners couldn’t be further from the truth. When lots of domestic cats live together – in places where humans provide copious amounts of food – they form social groups very similar to lion prides. Composed of related females, these cats are very friendly – grooming, playing with and lying on top of each other, nursing each other’s kittens, even serving as midwives during birth.
To signal friendly intentions, an approaching cat raises its tail straight up, a trait shared with lions and no other feline species. As anyone who has lived with a cat knows, they use this “I want to be friends” message toward people as well, indicating that they include us in their social circle.

Evolution of a master manipulator
Household cats are quite vocal to their human companions, using different meows to communicate different messages. Unlike the tail-up display, however, this is not an example of their treating us as part of their clan. Quite the contrary, cats rarely meow to one another.
The sound of these meows has evolved during domestication to more effectively communicate with us. Listeners rate the wildcat’s call as more urgent and demanding (“Mee‑O‑O‑O‑O‑O‑W!”) compared with the domestic cat’s more pleasing (“MEE‑ow”). Scientists suggest that these shorter, higher-pitched sounds are more pleasing to our auditory system, perhaps because young humans have high-pitched voices, and domestic cats have evolved accordingly to curry human favor.
Cats similarly manipulate people with their purrs. When they want something – picture a cat rubbing against your legs in the kitchen while you open a can of wet food – they purr extra loudly. And this purr is not the agreeable thrumming of a content cat, but an insistent chainsaw br-rr-oom demanding attention.
Scientists digitally compared the spectral qualities of the two types of purrs and discovered that the major difference is that the insistent purr includes a component very similar to the sound of a human baby crying. People, of course, are innately attuned to this sound, and cats have evolved to take advantage of this sensitivity to get our attention.
Of course, that won’t surprise anyone who’s lived with a cat. Although cats are very trainable – they’re very food motivated – cats usually train us more than we train them. As the old saw goes, “Dogs have owners, cats have staff.”![]()
Jonathan Losos, William H. Danforth Distinguished University Professor, Arts & Sciences at Washington University in St. Louis
This article is republished from The Conversation under a Creative Commons license. Read the original article.