How to resolve AdBlock issue?
News
- Details
- Written by: NATIONAL AERONAUTICS AND SPACE ADMINISTRATION
NASA’s Perseverance rover this week completed the collection of the first sample of Martian rock, a core from Jezero Crater slightly thicker than a pencil. Mission controllers at NASA’s Jet Propulsion Laboratory in Southern California received data that confirmed the historic milestone.
The core is now enclosed in an airtight titanium sample tube, making it available for retrieval in the future.
Through the Mars Sample Return campaign, NASA and the European Space Agency, or ESA, are planning a series of future missions to return the rover’s sample tubes to Earth for closer study. These samples would be the first set of scientifically identified and selected materials returned to our planet from another.
“NASA has a history of setting ambitious goals and then accomplishing them, reflecting our nation’s commitment to discovery and innovation,” said NASA Administrator Bill Nelson. “This is a momentous achievement and I can’t wait to see the incredible discoveries produced by Perseverance and our team.”
Along with identifying and collecting samples of rock and regolith (broken rock and dust) while searching for signs of ancient microscopic life, Perseverance’s mission includes studying the Jezero region to understand the geology and ancient habitability of the area, as well as to characterize the past climate.
“For all of NASA science, this is truly a historic moment,” said Thomas Zurbuchen, associate administrator for science at NASA Headquarters in Washington. “Just as the Apollo Moon missions demonstrated the enduring scientific value of returning samples from other worlds for analysis here on our planet, we will be doing the same with the samples Perseverance collects as part of our Mars Sample Return program. Using the most sophisticated science instruments on Earth, we expect jaw-dropping discoveries across a broad set of science areas, including exploration into the question of whether life once existed on Mars.”
First sample
The sample-taking process began on Wednesday, Sept. 1, when the rotary-percussive drill at the end of Perseverance’s robotic arm cored into a flat, briefcase-size Mars rock nicknamed “Rochette.”
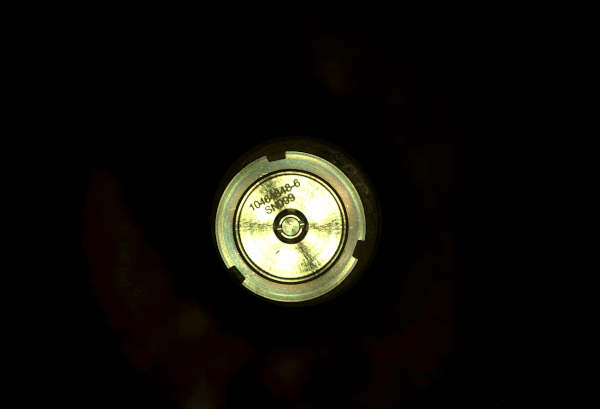
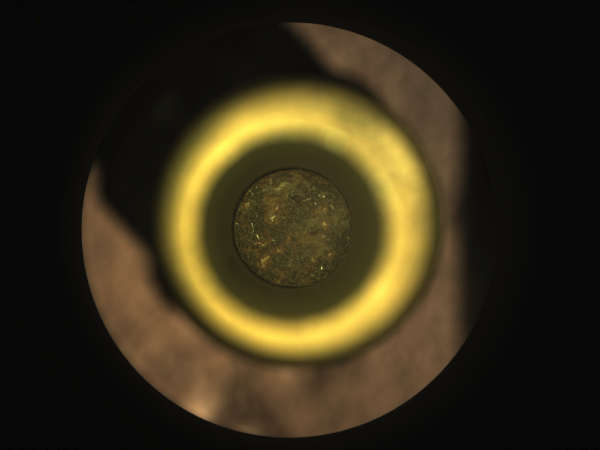
After completing the coring process, the arm maneuvered the corer, bit, and sample tube so the rover’s Mastcam-Z camera instrument could image the contents of the still-unsealed tube and transmit the results back to Earth. After mission controllers confirmed the cored rock’s presence in the tube, they sent a command to complete processing of the sample.
On Monday at 12:34 a.m. EDT, Perseverance transferred sample tube serial number 266 and its Martian cargo into the rover’s interior to measure and image the rock core. It then hermetically sealed the container, took another image, and stored the tube.
“With over 3,000 parts, the Sampling and Caching System is the most complex mechanism ever sent into space,” said Larry D. James, interim director of JPL. “Our Perseverance team is excited and proud to see the system perform so well on Mars and take the first step for returning samples to Earth. We also recognize that a worldwide team of NASA, industry partners, academia, and international space agencies contributed to and share in this historic success.”
First science campaign
Perseverance is currently exploring the rocky outcrops and boulders of “Artuby,” a ridgeline of more than a half-mile bordering two geologic units believed to contain Jezero Crater’s deepest and most ancient layers of exposed bedrock.
“Getting the first sample under our belt is a huge milestone,” said Perseverance Project Scientist Ken Farley of Caltech. “When we get these samples back on Earth, they are going to tell us a great deal about some of the earliest chapters in the evolution of Mars. But however geologically intriguing the contents of sample tube 266 will be, they won’t tell the complete story of this place. There is a lot of Jezero Crater left to explore, and we will continue our journey in the months and years ahead.”
The rover’s initial science foray, which spans hundreds of sols (Martian days), will be complete when Perseverance returns to its landing site. At that point, Perseverance will have traveled between 1.6 and 3.1 miles and may have filled as many as eight of its 43 sample tubes.
After that, Perseverance will travel north, then west, toward the location of its second science campaign: Jezero Crater’s delta region. The delta is the fan-shaped remains of the spot where an ancient river met a lake within the crater. The region may be especially rich in clay minerals. On Earth, such minerals can preserve fossilized signs of ancient microscopic life and are often associated with biological processes.
More about Perseverance
A key objective for Perseverance’s mission on Mars is astrobiology, including the search for signs of ancient microbial life. The rover will characterize the planet’s geology and past climate, pave the way for human exploration of the Red Planet, and be the first mission to collect and cache Martian rock and regolith.
Subsequent NASA missions, in cooperation with ESA, would send spacecraft to Mars to collect these sealed samples from the surface and return them to Earth for in-depth analysis.
The Mars 2020 Perseverance mission is part of NASA’s Moon to Mars exploration approach, which includes Artemis missions to the Moon that will help prepare for the first human exploration mission to the Red Planet.
JPL, which is managed for NASA by Caltech in Pasadena, California, built and manages operations of the Perseverance rover.
- Details
- Written by: Elizabeth Larson
At the end of the hour-and-a-half-long special meeting, the trustees voted to direct interim Chancellor James Houpis to develop and implement a COVID vaccine/testing requirement to increase vaccination rates for students, faculty, volunteers and staff, to be in place by the spring semester.
Six of the trustees voted for the policy, while the seventh, Jesse Ortiz, abstained.
Ortiz had sought to amend the proposed policy by requiring vaccination with no exceptions outside of the government requirements for religious and medical exemptions, but Trustee Dennise Burbank, who had offered the motion, didn’t agree to the change.
By taking the action, the Yuba Community College District joins 37 other community college districts in California that have adopted vaccine mandates for students and staff, with another district implementing a vaccination mandate just for students, district officials reported.
The other community college district that serves Lake County, the Mendocino-Lake Community College District, does not require students and employees to be vaccinated, but it is offering incentive programs.
On Aug. 12, the Yuba College trustees voted unanimously to direct the district’s leadership team to develop a vaccine and testing requirement recommendation protocol and resolution for the board's consideration in response to rising case rates across the district’s service area, which includes Lake County, as Lake County News has reported.
The cost to carry out the program is estimated at $3,465,000, including testing, student incentives, marketing, technology and staffing, including hiring four COVID tracers and a COVID manager to oversee the effort.
“This is not a vaccine mandate,” Houpis told the board during the special Thursday afternoon session.
Rather, he said it’s a requirement to either be vaccinated or have weekly testing.
Houpis also emphasized that it’s not a political issue, as people from both major political parties are encouraging vaccinations.
He said it’s disheartening that herd immunity hasn’t been achieved in 20 months, and pointed out that 35,000 people in the district’s eight county service area have been infected and more than 500 people have died during that time from an illness that is, for the most part, preventable.
With vaccination rates low for college-age individuals and college students representing a significant source of transition, and with the highly contagious Delta variant spreading, Houpis said it was incumbent on the district to move forward with a policy.
The longer it takes to move toward herd immunity, the more likely a new variant will come along that’s more contagious and deadly, Houpis said.
The plan Houpis and district leadership staff presented would require that all faculty, staff, administrators and volunteers be vaccinated effective Dec. 1, with a vaccination deadline of Jan. 24 — which also is the first day of the spring semester — for all students.
Those who don’t adhere to those deadlines must be tested weekly in order to be on district-owned or controlled premises or to participate in district activities for an extended amount of time.
Students who don’t get vaccinated also have the option of staying on distance learning.
At the same time, face coverings must be worn by everyone in all indoor settings, regardless of vaccination status.
Due to enforcement challenges, the district will require visitors to wear masks but won’t extend the vaccine or testing mandate to them. Vendors will be dealt with on a case-by-case basis.
In tracking that vaccination and testing information the policy will require the district to collect, it must follow the Confidentiality of Medical Information Act, or CMIA. The Health Insurance Portability and Accountability Act, or HIPAA, does not generally apply to schools.
Based on the timelines for implementing the program, the district’s new vaccination tracking system prototype must be in testing by Oct. 15, with that testing to be complete by Oct. 29 and in production from Nov. 12 to 14, as registration for the fall semester starts Nov. 15. The contact tracing system must be in production by Sept. 30, and ready to integrate with vaccine records by Jan. 24.
Ortiz said testing is not an alternative to vaccination, pointing to more than 600,000 Americans who have died from COVID-19.
He said people of color are disproportionately affected by the virus, adding that 70% of the district’s students are people of color. “Either we're in this all the way or we're not.”
Trustee David Wheeler also suggested a very strong policy with exceptions only for medical reasons.
Jake Hurley, associate vice chancellor of human resources, said the Equal Employment Opportunity Commission allows the district to mandate vaccinations for staff, but they must offer medical and religious exemptions, which the policy presented to the board does.
However, Hurley noted that people who don’t want to get vaccinated will exploit those loopholes. “That’s the reality.”
Ultimately, the board agreed to go with the policy staff presented, requiring vaccination or testing.
A concern voiced during the meeting was whether or not the district’s enrollment, which has been in decline, could see further drops because of the policy.
However, it also was suggested that the policy may increase enrollment as students — eager to get back to face-to-face instruction — feel safer being back on campus.
Email Elizabeth Larson at
- Details
- Written by: Lake County News reports
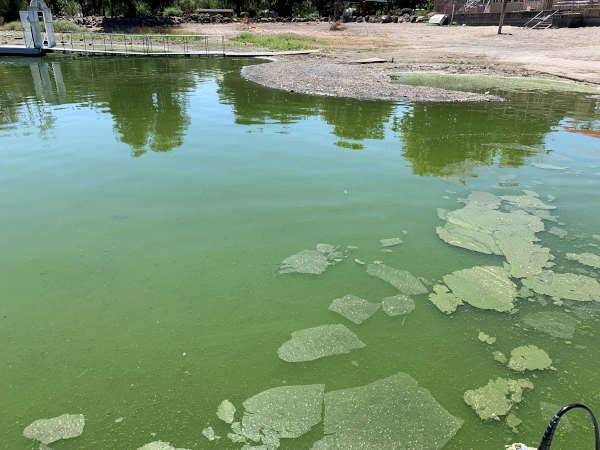
LAKE COUNTY, Calif. — Officials reported that recent testing of sites on Clear Lake have shown dangerous levels of cyanotoxin.
While much of the aquatic plant growth visible in the lake right now is harmless, cyanobacteria, when present in sufficient abundance, can produce cyanotoxins, which pose health hazards to humans, livestock and pets.
Water monitoring is regularly conducted by the Big Valley Band of Pomo Indians with assistance from Robinson Rancheria EPA Department, at approximately 15 Clear Lake sites.
All verified results are publicly available here.
Currently, concentrations of microcystin cyanotoxin at numerous locations around the lake are extremely high.
During recent sampling conducted on Tuesday, Aug. 25, EPA lab-confirmed testing indicated the highest levels of two toxins that have been recorded on Clear Lake during water sampling events: a microcystin (liver toxin) result value of almost 26,000 micrograms per liter (µg/L) and an anatoxin-a (neurotoxin) result value of almost 13 µg/L.
The nine locations with DANGER levels of Cyanotoxin are the following (also see yellow CAUTION indicators on the map, below):
— Clearlake Oaks (CLOAKS01, Oaks Arm).
— Elem Indian Colony shoreline (ELEM01, Oaks Arm).
— Sulphur Bank Mercury Mine shoreline (SBMMEL01, Oaks Arm).
— Lily Cove (LC01, Lower Arm).
— Austin Park (AP01, Lower Arm).
— Redbud Park (RED01, Lower Arm).
— Shady Acres (SHADY01, Cache Creek).
— Jago Bay (JB, Lower Arm).
— Lakeport, Library Park (LPTNT, Upper Arm).
Public Health urges boaters and other recreational lake users to avoid direct contact with or use of waters containing cyanobacteria in Lake County and to follow all posted signage regarding safe activities.
This recommendation is based on the recent toxin results as well as the potential health risks from cyanobacteria, which is currently blooming at varying levels throughout the lake.
Cyanobacteria can pose health risks, particularly to children and pets. Officials urge people to choose safe activities when visiting natural bodies of water, particularly where blooms are visible.
It is strongly recommended people and their pets avoid contact with and avoid swallowing lake water in areas where algal blooms are present.
Conditions can quickly change. Before recreating in Clear Lake, check the most recent monitoring results.
For current cyanotoxin lab results, please visit the Big Valley Band of Pomo Indians cyanotoxin monitoring website and Clear Lake Water Quality Facebook page.
Further resources are available at the following webpages:
http://www.lakecountyca.gov/cyanobacteria/
http://www.lakecountyca.gov/cyanohealth/
California Portal on Harmful Algal Blooms:
https://mywaterquality.ca.gov/habs/index.html
CDC guidance regarding harmful algal blooms can be found here:
https://www.cdc.gov/habs/materials/factsheet-cyanobacterial-habs.html

- Details
- Written by: JUSTIN JARRETT
The World Health Organization, or WHO, declared COVID-19 a pandemic on March 11, 2020.
After that, many doctors in the U.S. delayed elective medical procedures and Medical and Diagnostic Laboratories developed a variety of COVID-19 tests.
Did those changes have uneven economic impacts on health care operations?
They did, according to an analysis of the Census Bureau’s Quarterly Services Survey, or QSS, data on doctor visits, lab and diagnostic testing, and hospital visits.
The data show that some health care industries that normally follow similar economic patterns diverged in some quarters during the pandemic.
All revenue data contained in this article are seasonally adjusted, but hospital inpatient days and discharges data are not.
The data show that some health care industries that normally follow similar economic patterns diverged in some quarters during the pandemic.
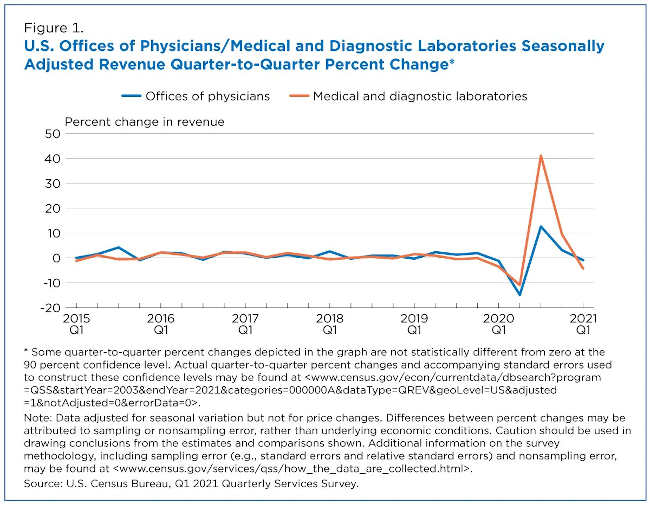
For example, before the pandemic, visiting the doctor and getting lab tests were commonly linked (Figure 1). But during the pandemic, lab testing surged higher than visits to doctors’ offices — a shift known as divergence.
While the revenue of both Offices of Physicians and Medical and Diagnostic Laboratories fell significantly in the second quarter of 2020 — down 14.9% and 10.9% respectively from the first quarter of 2020 — there was some divergence afterward.
In the third quarter of 2020, revenue for Medical and Diagnostic Laboratories increased 41.1% from the previous quarter. Nationwide COVID-19 testing was a central factor.
Revenue for the Offices of Physicians also rebounded in the third quarter of 2020, but the 12.6% quarter-to-quarter change was not as pronounced as the increase for Medical and Diagnostic Laboratories.
A tale of two recoveries
By the fourth quarter of 2020 and first quarter of 2021, the percentage changes had decreased compared to the spikes in the third quarter of 2020 for both industries.
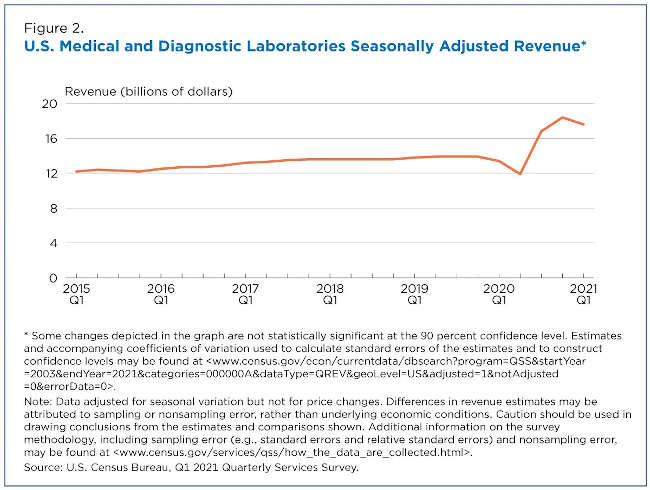
However, it’s notable that revenue of Medical and Diagnostic Laboratories remained much higher than before COVID-19 (Figure 2).
Total revenue of Medical and Diagnostic Laboratories increased 9.4% from $16.8 billion in the third quarter to $18.4 billion in the fourth quarter of 2020. But it fell 4.3% to $17.6 billion in the first quarter of 2021.
Importantly, total revenue in the first quarter of 2021 was higher than the $13.4 billion in the first quarter of 2020.
The QSS estimates show that total revenue levels for Medical and Diagnostic Laboratories remain elevated during widespread COVID-19 testing in the United States. In fact, the Centers for Disease Control (CDC) Data Tracker tallied more than 375 million COVID-19 RT-PCR tests by the end of the first quarter of 2021.
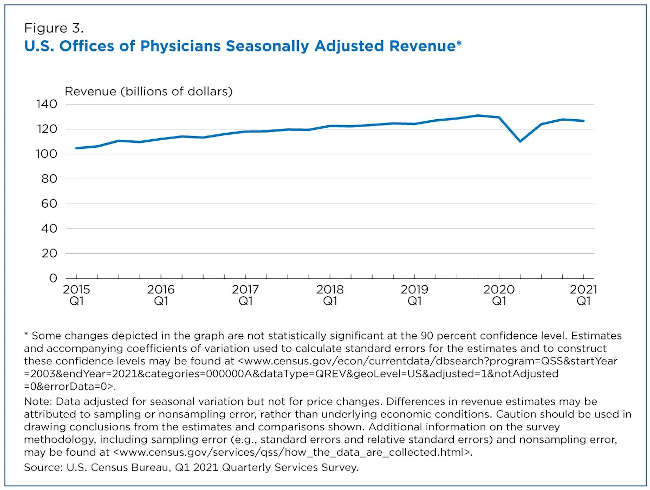
In contrast, total revenue for Offices of Physicians was approximately $129.5 billion in the first quarter of 2020 and $126.7 billion in the first quarter of 2021 — a year-over-year change that is not significant (Figure 3).
This implies that the volume of routine office visits in the first quarter of 2021 weren’t much different from when the pandemic began in the first quarter of 2020. One February 2021 study by The Harris Poll found that 27% of 1,093 U.S. adults polled had delayed annual checkups in the prior three months.
Hospital services and tax breakouts
The Coronavirus Aid, Relief, and Economic Security, or CARES, Act was signed into law March 27, 2020, in response to the economic uncertainties created by the COVID-19 pandemic.
Subsequently, the U.S. Department of Health and Human Services, or HHS, established the Provider Relief Fund program. Relief funds were distributed to the nation’s Hospitals, tax-exempt and taxable alike.
It is important to note that the QSS collects revenue differently between tax-exempt and taxable firms on its hospital survey forms.
The QSS asks tax-exempt firms to include nonoperating grant revenue in the calculation of total revenue as it’s generally a routine source of revenue for tax-exempt hospitals. However, the QSS asks taxable firms to exclude nonoperating grant revenue in the calculation of total revenue as it’s generally not a routine source of revenue for taxable hospitals.
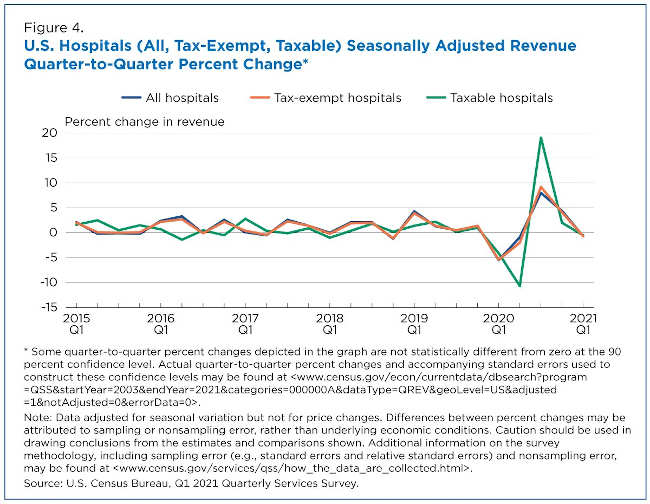
The quarter-to-quarter percentage changes for the hospital industry closely mirror its largest subset: tax-exempt hospitals that make up approximately 88% of the industry (Figure 4).
The QSS data show that revenue for tax-exempt hospitals dropped 5.5% in the first quarter of 2020. Revenue for taxable hospitals dropped 4.1% in the first quarter and another 10.7% in the second quarter of 2020.
Hospital revenue increased significantly in the third quarter of 2020 with taxable hospitals up the most with a 19.1% increase from the second quarter of 2020. By the first quarter of 2021, total revenue for the hospital industry was up 10.6% compared to the first quarter of 2020.
Hospital inpatient days and discharges
Based on the revenue growth, one might think that year-over-year percentage increases in revenue would mean more volume for America’s hospitals. The QSS data tell a different story.
For QSS, inpatient days measure the length of a hospital stay during which services were provided to inpatients. A discharge is the formal release of the patient (including those admitted and discharged on the same day).
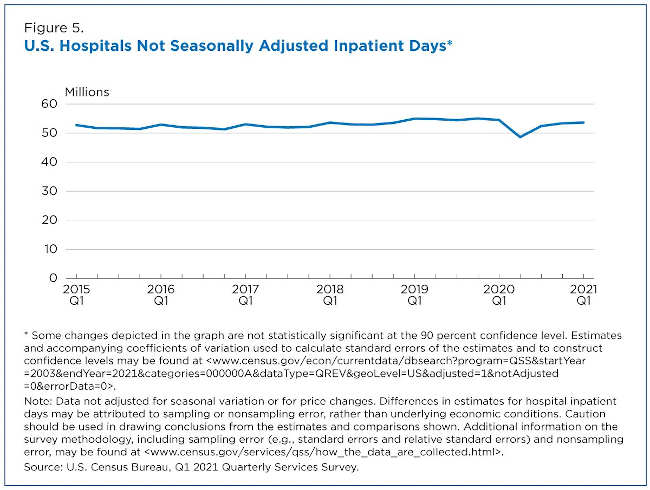
Hospital inpatient days dropped from approximately 54.5 million in the first quarter of 2020 to 48.6 million in the second quarter of 2020 — a decrease of 10.8%. The decline could be due to fewer elective surgeries being scheduled during the early part of the pandemic as recommended by the Centers for Medicare & Medicaid Services (CMS).
By the first quarter of 2021, inpatient days were 53.6 million (Figure 5).
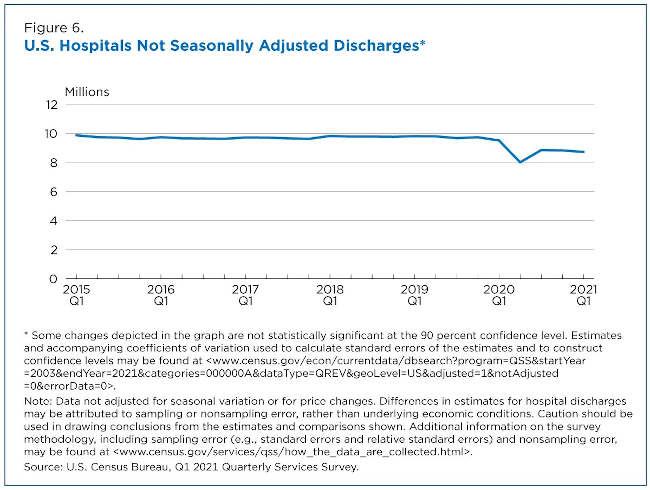
Hospital discharges dropped 15.9% from approximately 9.5 million in the first quarter of 2020 to 8.0 million in the second quarter of 2020. By the first quarter of 2021, there were 8.7 million discharges (Figure 6).
QSS data indicate that hospital revenue percentage change was up in the first quarter of 2021 from the first quarter of 2020. However, hospital inpatient days and discharges show that volume wasn’t significantly different year-over-year.
Some private sector reports support this result as hospital volume metrics, particularly emergency room visits, continued to lag.
The health care industries above demonstrate how the COVID-19 pandemic has unevenly affected a key sector in the U.S. economy — a sector facing one of its greatest public health challenges in decades.
Justin Jarrett is a survey statistician in the Census Bureau’s Economic Indicators Division.