 How to resolve AdBlock issue?
News
- Details
- Written by: CAL FIRE
Fire Prevention Week this year is Oct. 9 to 15.
This year’s theme brings quick action safety measures front of mind for residents to utilize in the event of a home fire.
Cal Fire urges all residents to incorporate this year’s Fire Prevention Week theme because homes can burn fast. In some instances, you may have as little as two minutes or less to safely escape a home fire once the smoke alarm sounds.
After all, you plan for vacations, holidays, and weekly meals, why not plan to save your life and those around you in the event of a home fire?
“Too many lives are lost in home fires each year in California,” said State Fire Marshal Chief Mike Richwine. “According to a newly-released National Fire Protection Association report, U.S. home fire deaths hit a 14-year high last year, marking the critical importance of Fire Prevention Week and the reminder to plan and practice a home fire escape so that action can be taken when the smoke alarm sounds.”
There are two key factors critical to safely escaping a home fire: early warning from smoke alarms and advance planning.
Accordingly, this year’s Fire Prevention Week concept offers a blueprint to guide you and yours safely and swiftly out of a home fire. Invest a little time now so that you and yours are ready for the fire that won’t wait.
Some action items you can take to equip your home and plan your escape are:
• Make the first Saturday of each month “Smoke Alarm Saturday” - a working smoke alarm will clue you in that there is a fire, and you need to escape.
• Strategically install smoke alarms in every sleeping room, outside each sleeping area, every level of the home and the basement.
• Test the alarms regularly by pressing the test button and change the battery if there’s no sound or the sound is low. If your smoke alarm chirps, change the battery immediately.
• Develop a home fire escape plan and rehearse it with all family members at least twice a year!
• Map the escape route including windows and doors—make sure the route is free of obstacles.
• Predetermine an outside meeting place that’s a safe distance in front of your home.
• Everyone should know the fire department’s emergency number and how to call when they’re safely outside.
For more information about Fire Prevention Week and general fire prevention practices, visit www.fpw.org.
- Details
- Written by: Patricia Fabian, Boston University and Jonathan Levy, Boston University
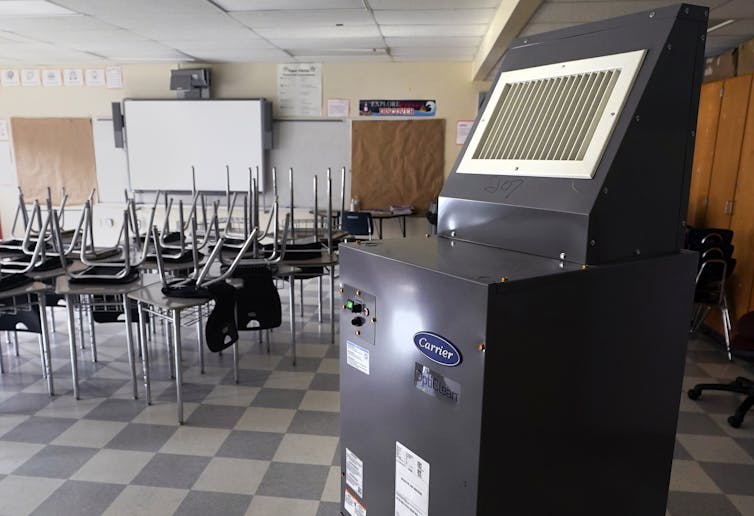
As fall temperatures cool across the U.S., many schools will struggle to ventilate classrooms while also keeping students and teachers comfortable and healthy. Children and teachers spend over six hours a day in classrooms during the school year, often in buildings that are decades old and have inadequate heating, ventilation and air conditioning, or HVAC, systems.
Fall 2022 marks the start of the fourth school year affected by the COVID-19 pandemic, which has spotlighted the importance of indoor air quality in schools. Ideally, all school buildings would have adequate ventilation, filtered air in each classroom and windows that open. Sadly, this is not the case – and indoor air quality in many schools is poor as a result. This is especially problematic in the wake of the U.S. Centers for Disease Control and Prevention’s August 2022 COVID-19 guidance for schools, which scales back other measures for limiting transmission, such as masking, testing and quarantining.
Beyond minimizing COVID-19 transmission, indoor air quality also matters for student academic performance. This is especially important given the learning losses that many children experienced in the first two years of the pandemic. Hot, stuffy classrooms make it harder for students to learn. So do cold classrooms.
Our research focuses on indoor environments and health – an area that has received increased attention during the pandemic, since most COVID-19 transmission occurs through shared air indoors. There is ample evidence that smart investments in school buildings can reduce transmission of infectious disease, while also improving learning and increasing well-being for students, teachers and administrators.
Many school districts have limited resources and buildings in poor condition. Where should they start? Here are some priorities we see for immediate action and longer-term investments that can truly transform the school experience.
Filters and fresh air
Since the spring of 2020, schools have invested millions of dollars in interventions to reduce COVID-19 transmission, including high-efficiency, free-standing commercial filter units and ventilation upgrades. These actions are a drop in the bucket, given the structural improvements needed in many schools, especially in less wealthy school districts, but they are an important start. And their benefits extend beyond COVID-19, so they should not be discarded.
For example, high-efficiency filters – including commercial units, DIY boxes or filters with ratings of MERV-13 for HVAC systems – capture flu and common cold viruses as well as SARS-CoV-2 virus particles. They also clean the air of pollen particles, mold spores and pollution from car exhaust and industrial operations. And in areas where wildfires are common, filters reduce the concentration of smoke particles inside buildings.
Schools with mechanical ventilation have been able to increase the amount of filtered fresh air that these systems pull indoors. This dilutes all indoor pollutants. For kids and school staff, particularly those with asthma, allergies and sensitivities, this can mean fewer missed days of school, less medication, and fewer asthma attacks and subsequent trips to the hospital.
Improved ventilation can actually increase learning and attention. A 2010 study showed that kids performed better on standardized tests when ventilation rates were higher. Poor ventilation may also affect teachers: A 2016 study found that office workers’ cognitive performance improved when they were exposed to lower carbon dioxide levels, which is a marker of better ventilation. And a 2018 analysis showed that students’ performance on school tests declined on hot days, especially in schools without air conditioning. If you’ve ever felt that it was hard to concentrate in a hot, stuffy room, the science backs you up.
For now, we recommend that schools that have put improvements in place should maintain increased ventilation rates with maximum fresh air, continue to use high-efficiency filters in their HVAC systems and keep free-standing filters running in classrooms. Schools that have not invested in these steps should do so, with states providing funding to lower-resourced districts as needed. The costs of these steps are modest compared with the benefits they provide for health and learning.
Families and staff who want to improve conditions in their schools should focus on providing every classroom with improved ventilation and filtration, including building DIY boxes, if necessary.
Funding for healthier buildings
These near-term solutions can help, but the best way to ensure that schools provide healthy conditions for learning is by investing in healthier buildings.
Funds for this purpose are available now. All U.S. states have received millions of dollars from the American Rescue Plan, enacted in 2021 to address the impact of COVID-19, including Elementary and Secondary Schools Emergency Relief, or ESSER, funds. The Department of Education has disbursed US$122 billion to help schools prevent the spread of COVID-19 and operate safely.
School districts have used this money to address a variety of needs, including staffing, academic support and mental health, but much of it is still available. And only a handful of states have invested in HVAC. According to a review by the independent Brookings Institution, less than 5% of the money from the most recent round of ESSER funds had been spent through the first quarter of 2022.
Another $3 billion was authorized in the recently enacted Inflation Reduction Act for environmental and climate justice block grants. These can be used to upgrade buildings and ventilation systems to reduce indoor air pollution.
School districts may be tempted to put indoor air interventions on the back burner, given widespread perceptions that the pandemic is over and the many other challenges they face. But in our view, other educational interventions will be less effective if kids are frequently absent due to illness or unable to concentrate in the classroom.
We believe it is important for families and staff to understand the benefits that healthy indoor learning environments offer to everyone who spends time in school buildings, and to hold states and school districts accountable for investing now in HVAC improvements for healthier school buildings.![]()
Patricia Fabian, Associate Professor of Environmental Health, Boston University and Jonathan Levy, Professor and Chair, Department of Environmental Health, Boston University
This article is republished from The Conversation under a Creative Commons license. Read the original article.
- Details
- Written by: Craig Benson
The national poverty rate was 12.8% in 2021, but was significantly different for the nation’s oldest and youngest populations, according to a new Census Bureau report released today.
The child poverty rate (for people under age 18) was 16.9% in 2021, 4.2 percentage points higher than the national rate, while poverty for those ages 65 and over was 10.3%, 2.5 percentage points lower than the national rate.
The American Community Survey (ACS) 1-year estimates provide data for a number of demographic, social and economic indicators, including poverty. The estimates are used by planners, policymakers and community stakeholders to evaluate trends and make comparisons across demographic groups.
Government agencies, researchers and local organizations regularly use these estimates to measure economic well-being and identify the number of individuals and families eligible for various programs.
How poverty is measured
Poverty status is determined by comparing annual income to a set of dollar values (called poverty thresholds) that vary by family size, number of children and the age of the householder.
If a family’s pre-tax income is less than the dollar value of their threshold, that family and every member are considered to be in poverty. For people not living in families, poverty status is determined by comparing the individual’s income to their poverty threshold.
The poverty measure excludes children under the age of 15 who are not related to the householder, people living in institutional group quarters – such as correctional facilities and nursing homes – as well as people living in college dormitories or military barracks.
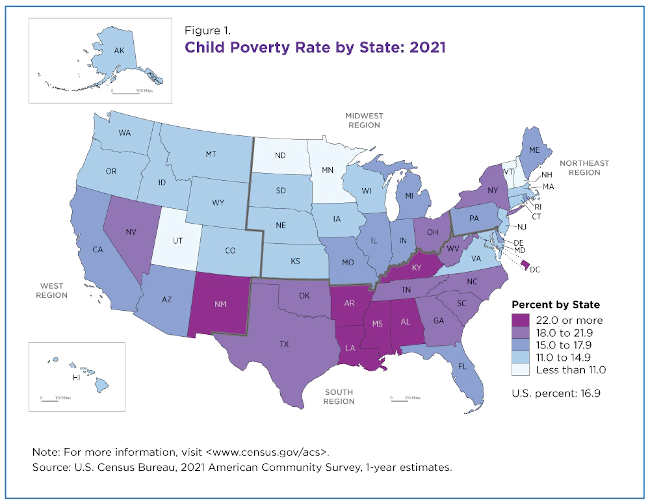
Child poverty by state, region and metro
The national child poverty rate was 16.9% but there was considerable variation among states, ranging from 8.1% to 27.7%.
Figure 1 illustrates the uneven geographic distribution of child poverty in every state and the District of Columbia.
Three-quarters of states in the South region (12 states) and the District of Columbia had child poverty rates of at least 18.0%.
The Midwest and Northeast each had only one state with child poverty rates of at least 18.0% and the West had two.
Child poverty rates by state:
• Among the lowest were Utah (8.1%) and New Hampshire (9.2%). (These estimates are not significantly different from one another.)
• Among the highest were Mississippi (27.7%), Louisiana (26.9%) and the District of Columbia (23.9%). (These estimates are not significantly different from one another.)
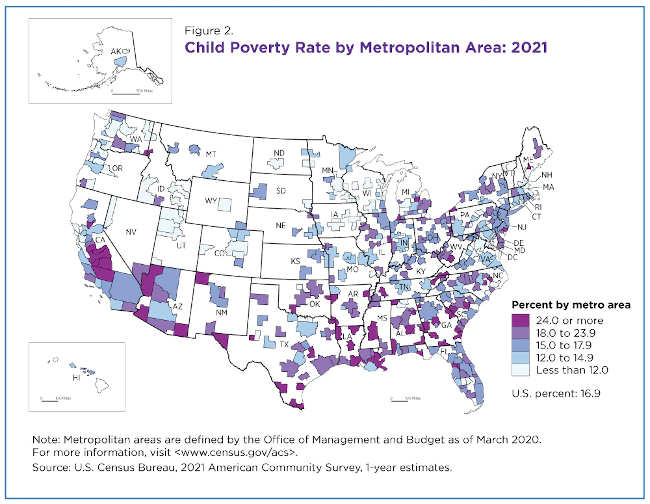
Child poverty rates also varied widely – from 2.1% to 39.2% – among the nation’s 384 Metropolitan Statistical Areas or metro areas in 2021 (Figure 2).
Forty-one (69.5%) of the 59 metro areas with the nation’s highest child poverty rates were in the South and accounted for 26.3% of all of the region’s 156 metro areas.
In contrast, only 5.1% of metro areas in the highest child poverty rate category were in the Northeast and the Midwest, and 20.3% in the West. More than a third (31 of 86) of the metro areas in the lowest child poverty category were in the West; these metro areas accounted for over 35% of the region’s total metro areas.
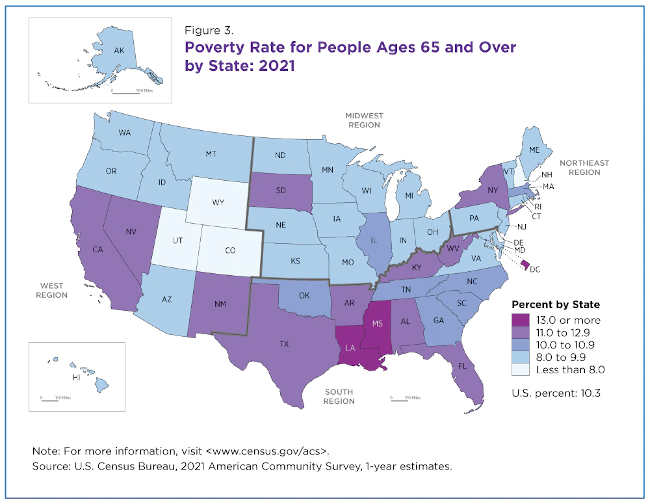
Poverty rate for people ages 65 and over
In 2021, the national poverty rate for people ages 65 and over was 10.3%, significantly lower than the poverty rate for all people and the child poverty rate.
There were geographic variations in these poverty rates though not as pronounced as for the child poverty rate. The poverty rates for the older population ranged from 6.7% to 14.1% (Figure 3).
The South had eight states and the District of Columbia with poverty rates of 11.0% or more. No other region had more than three states with such high poverty rates for the 65-plus population.
Ages 65 and over poverty rates by state:
Among the lowest: Wyoming (6.7%), New Hampshire (6.9%), Delaware (6.9%), Utah (7.7%), and Colorado (7.7%). (These estimates are not significantly different from one another.)
Among the highest: Louisiana (14.1%), the District of Columbia (13.8%), Mississippi (13.8%) and New Mexico (12.8%). (These estimates are not significantly different from one another.)
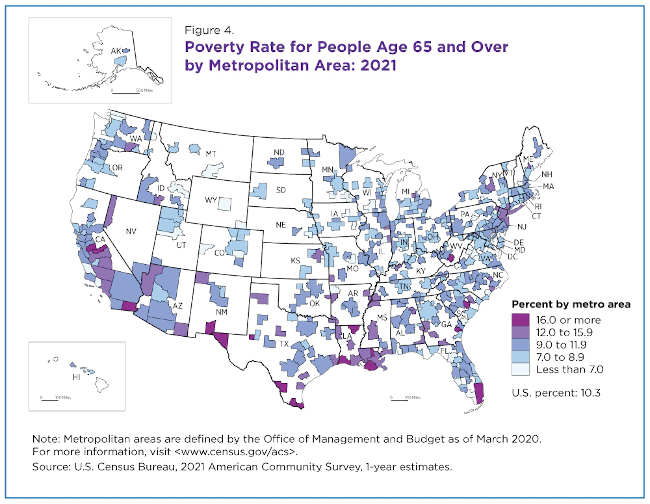
There were even greater variations in the poverty of the older populations between metro areas – from 3.1% to 31.6% (Figure 4).
The majority (276 or 71.9%) of the nation’s 384 metro areas had poverty rates for people ages 65 and over that fell into two categories on the map: 7.0%-8.9% and 9.0%-11.9%.
Of the 61 metro areas with poverty rates at 12.0% or higher for people ages 65 and over, 53 were in the South (39) or the West (14). The South had 25% of all its metro areas in the two highest poverty categories compared to just 5.4% of those in the Midwest.
Additional poverty data from the 2021 release and links to poverty estimates from other surveys such as the Current Population Survey Annual Social and Economic Supplement (CPS ASEC) and the Survey of Income and Program Participation (SIPP) are available on this topics page.
Craig Benson is a survey statistician in the Census Bureau’s Poverty Statistics Branch.
- Details
- Written by: CALIFORNIA CONTROLLER’S OFFICE
The data cover more than 404,000 positions and approximately $23.94 billion in total wages.
Users of the site can view compensation levels on maps and search by region; narrow results by name of the entity or by job title; and export raw data or custom reports.
All 11 UC institutions — including 10 campuses and the Office of the President — voluntarily filed compliant reports with the State Controller’s Office (SCO). UC data cover 299,448 employees and more than $19.19 billion in total wages.
Forty-four CCC districts voluntarily filed compliant reports with SCO. CCC data published cover 104,856 employees and more than $4.74 billion in total wages.
Fourteen CCC districts did not file a report with SCO, while another 14 filed reports that were not compliant.
Among those districts which did not file are the two districts serving Lake County: the Mendocino-Lake Community College District and the Yuba Community College District.
California law requires cities, counties, and special districts to annually report compensation data to the State Controller.
The state controller also maintains and publishes state and CSU salary data. No such statutory requirement exists for UC, CCCs, superior courts, fairs and expositions, First 5 commissions, or K-12 education providers; their reporting is voluntary.
Since the website launched in 2010, it has registered more than 14 million pageviews. The site contains pay and benefit information on more than two million government jobs in California, as reported annually by each entity.
As the chief fiscal officer of California, Controller Yee is responsible for accountability and disbursement of the state’s financial resources. The controller has independent auditing authority over government agencies that spend state funds. She is a member of numerous financing authorities, and fiscal and financial oversight entities including the Franchise Tax Board. She also serves on the boards for the nation’s two largest public pension funds.