 How to resolve AdBlock issue?
News
- Details
- Written by: LAKE COUNTY NEWS REPORTS
The group will meet at 5 p.m. at the Scotts Valley Women’s Clubhouse, 2298 Hendricks Road in Lakeport.
Council business includes Fourth District updates and news, the council’s boundary of influence, roadwork and utilities for Scotts Valley community roads, the land use permit report, Clear Lake hitch in the Scotts Valley area, and groundwater updates and observation.
There also will be discussion regarding maintenance of Scotts Creek, including input on efforts to clean out the creek, tree and gravel removal, and replacement, repair and maintenance of water flow gauges at the Green River and Eickhoff bridges.
Under new business, the council will discuss the procedure to submit meeting minutes and plan for the Fall Neighborfest.
The council includes Chair Greg Scott, Vice Chair Jared Hendricks, Secretary Jason Weston, and members Jody Altic and Cornelia Sieber-Davis.
- Details
- Written by: Benjamin Gurrentz and R. Chase Sawyer
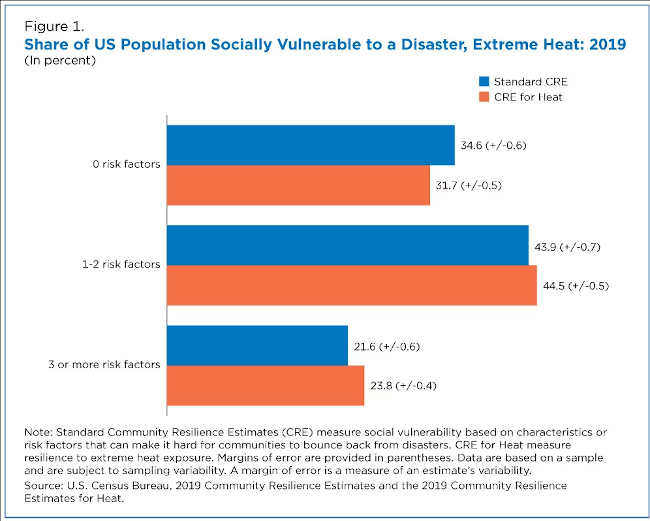
Almost 1 in 4 people in the United States are socially vulnerable and have low resilience to extreme heat exposure, according to new U.S. Census Bureau data.
The Community Resilience Estimates, or CRE, for Heat, an experimental data product released in April, measures the capacity of individuals and households in a community to withstand the stress of exposure to extreme heat based on their social characteristics.
The standard CRE measures social vulnerability that inhibits community resilience while the CRE for Heat adjusts certain risk factors like quality of housing, transportation modes and financial hardship to gauge social vulnerability specifically to extreme heat exposure.
The tool produces national, state, county and census tract (neighborhood equivalent) estimates using individual and household data from the 2019 American Community Survey, or ACS, restricted microdata and the Census Bureau’s Population Estimates Program, or PEP.
The experimental climate-focused data product was developed with Arizona State University’s Knowledge Exchange for Resilience, known as KER. The product was released at a joint Census Bureau-KER climate resilience symposium in Washington, D.C.
“This collaboration is an example of how we can leverage data and innovation to identify and address social inequalities and improve the resilience of communities in the face of climate change,” said Patricia Solís, KER’s executive director.
CRE for Heat findings
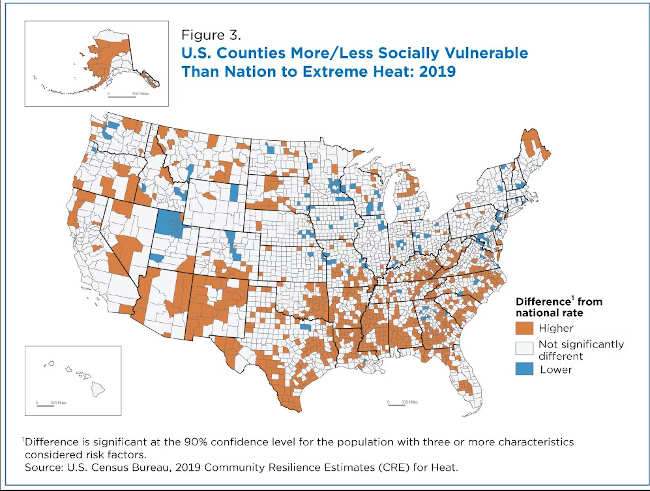
CRE for Heat suggests greater social vulnerability and geographic variation compared to the standard CRE.
When measuring social vulnerability to heat exposure, the proportion of individuals with three or more risk factors increases from 21.6% in the standard CRE to 23.8% in CRE for Heat.
Similarly, the share with 0 risk factors decreases from 34.6% in the standard CRE to 31.7% in CRE for Heat.
In other words, when accounting for additional housing and transportation characteristics, more people in the United States are socially vulnerable or less resilient to rising heat temperatures.
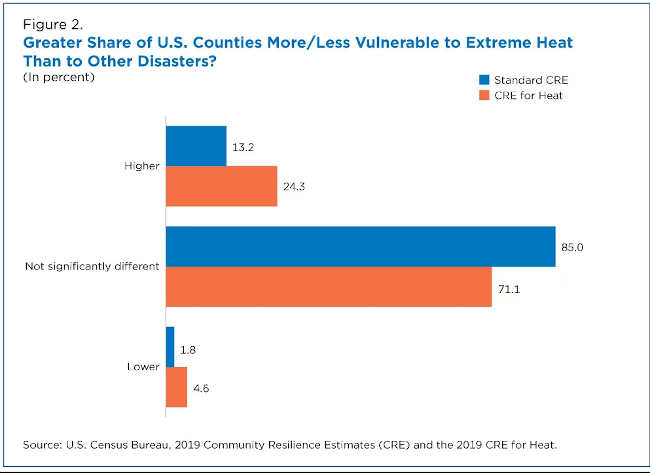
There were also differences in the number of areas flagged as statistically higher or lower than the national rate.
The CRE for Heat shows that 24.3% of counties have a greater proportion of individuals with three or more risk factors than the national rate — much higher than the 13.2% in the standard CRE.
At the same time, 4.6% of counties had a lower proportion of individuals with high risk (3+ risk factors) compared to the national rate, higher than the 1.8% in the standard CRE. This suggests the additional heat exposure risk factors produce greater distinctions across U.S. counties.
How CRE for heat came about
The first CRE was published as an experimental data product in June 2020 to provide information about the COVID-19 pandemic. It was also published to garner feedback from data users and stakeholders on the quality and usefulness of such a product.
KER reached out to the CRE team to further discuss the product and was particularly interested in how the CRE could be leveraged for measuring social vulnerability to heat exposure.
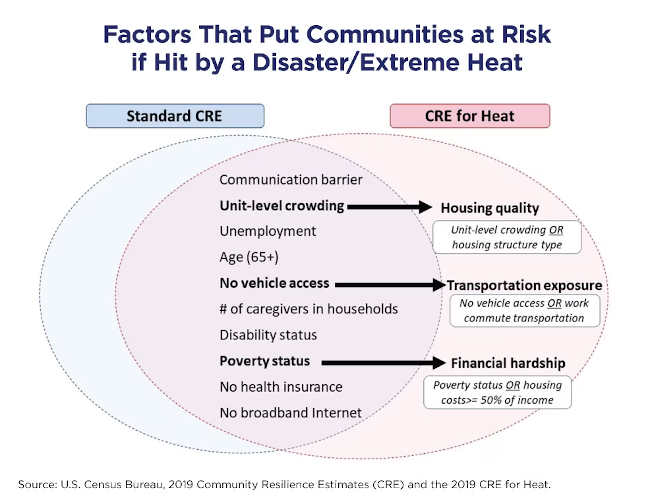
In consultation with KER, the CRE modified three of the 10 risk factors to adjust for social vulnerability to heat exposure.
While the standard CRE simply had a unit level crowding measure (0.75 people or more per room), CRE for heat has a housing-quality exposure indicator that also accounts for structure type or where people live (mobile home, boat, RV, or other).
Also, the original CRE has an indicator for no household vehicle but the CRE for Heat’s transportation exposure indicator also contains commute type (public transportation, walking, biking or other nonpersonal vehicle method).
Finally, while the CRE simply had a poverty indicator, the CRE for Heat’s financial hardship indicator also includes whether the household’s housing costs are greater than 50%.
Even though the number of risk factors didn’t change in the CRE for Heat, some characteristics or conditions like transportation modes were added. A person only needs to meet one of the conditions to receive a risk factor flag. For example, if a household does not have unit-level crowding but lives in a mobile home, it will be flagged for having a housing quality risk. If the household meets both conditions, it’s only flagged once.
Factors that put communities at risk if hit by a disaster/extreme heat
It is important to note that CRE for Heat does not measure which areas are warmer than others or which areas are more likely to experience future heat waves. Instead, it identifies which areas exhibit low resilience if faced with extreme heat.
This new product comes with the same goals as the original CRE. Its publication should provide a new useful data source about a pressing topic and allow data users and stakeholders to provide feedback on potential enhancements.
Benjamin Gurrentz is a survey statistician in the Census Bureau’s Small Area Modeling and Development Branch – Social, Economic, and Housing Statistics Division. R. Chase Sawyer is the technical lead for Modeled Data Product Development in Small Area and Longitudinal Estimates – Social, Economic, and Housing Statistics Division.
- Details
- Written by: Darrell Kaufman, Northern Arizona University

As scorching heat grips large swaths of the Earth, a lot of people are trying to put the extreme temperatures into context and asking: When was it ever this hot before?
Globally, 2023 has seen some of the hottest days in modern measurements, but what about farther back, before weather stations and satellites?
Some news outlets have reported that daily temperatures hit a 100,000-year high.
As a paleoclimate scientist who studies temperatures of the past, I see where this claim comes from, but I cringe at the inexact headlines. While this claim may well be correct, there are no detailed temperature records extending back 100,000 years, so we don’t know for sure.
Here’s what we can confidently say about when Earth was last this hot.
This is a new climate state
Scientists concluded a few years ago that Earth had entered a new climate state not seen in more than 100,000 years. As fellow climate scientist Nick McKay and I recently discussed in a scientific journal article, that conclusion was part of a climate assessment report published by the Intergovernmental Panel on Climate Change (IPCC) in 2021.
Earth was already more than 1 degree Celsius (1.8 Fahrenheit) warmer than preindustrial times, and the levels of greenhouse gases in the atmosphere were high enough to assure temperatures would stay elevated for a long time.
Even under the most optimistic scenarios of the future – in which humans stop burning fossil fuels and reduce other greenhouse gas emissions – average global temperature will very likely remain at least 1 C above preindustrial temperatures, and possibly much higher, for multiple centuries.
This new climate state, characterized by a multi-century global warming level of 1 C and higher, can be reliably compared with temperature reconstructions from the very distant past.
How we estimate past temperature
To reconstruct temperatures from times before thermometers, paleoclimate scientists rely on information stored in a variety of natural archives.
The most widespread archive going back many thousands of years is at the bottom of lakes and oceans, where an assortment of biological, chemical and physical evidence offers clues to the past. These materials build up continuously over time and can be analyzed by extracting a sediment core from the lake bed or ocean floor.

These sediment-based records are rich sources of information that have enabled paleoclimate scientists to reconstruct past global temperatures, but they have important limitations.
For one, bottom currents and burrowing organisms can mix the sediment, blurring any short-term temperature spikes. For another, the timeline for each record is not known precisely, so when multiple records are averaged together to estimate past global temperature, fine-scale fluctuations can be canceled out.
Because of this, paleoclimate scientists are reluctant to compare the long-term record of past temperature with short-term extremes.
Looking back tens of thousands of years
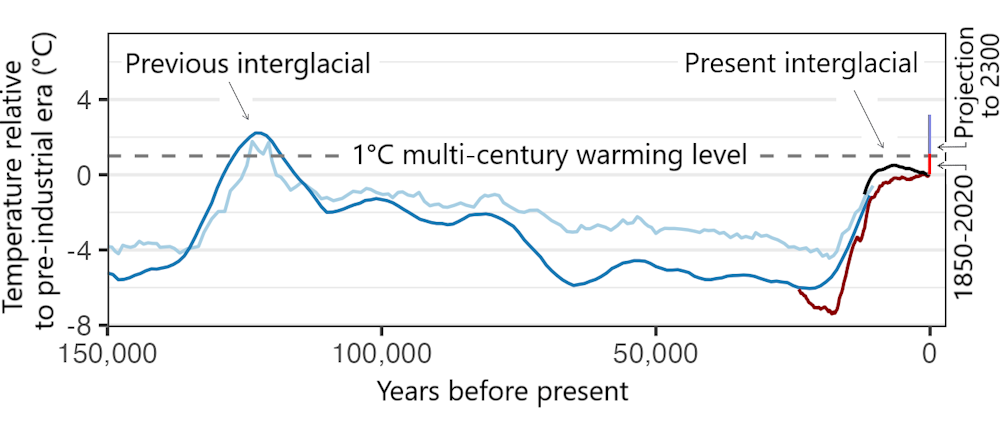
Earth’s average global temperature has fluctuated between glacial and interglacial conditions in cycles lasting around 100,000 years, driven largely by slow and predictable changes in Earth’s orbit with attendant changes in greenhouse gas concentrations in the atmosphere. We are currently in an interglacial period that began around 12,000 years ago as ice sheets retreated and greenhouse gases rose.
Looking at that 12,000-year interglacial period, global temperature averaged over multiple centuries might have peaked roughly around 6,000 years ago, but probably did not exceed the 1 C global warming level at that point, according to the IPCC report. Another study found that global average temperatures continued to increase across the interglacial period. This is a topic of active research.
That means we have to look farther back to find a time that might have been as warm as today.
The last glacial episode lasted nearly 100,000 years. There is no evidence that long-term global temperatures reached the preindustrial baseline anytime during that period.
If we look even farther back, to the previous interglacial period, which peaked around 125,000 years ago, we do find evidence of warmer temperatures. The evidence suggests the long-term average temperature was probably no more than 1.5 C (2.7 F) above preindustrial levels – not much more than the current global warming level.
Now what?
Without rapid and sustained reductions in greenhouse gas emissions, the Earth is currently on course to reach temperatures of roughly 3 C (5.4 F) above preindustrial levels by the end of the century, and possibly quite a bit higher.
At that point, we would need to look back millions of years to find a climate state with temperatures as hot. That would take us back to the previous geologic epoch, the Pliocene, when the Earth’s climate was a distant relative of the one that sustained the rise of agriculture and civilization.![]()
Darrell Kaufman, Professor of Earth and Environmental Sciences, Northern Arizona University
This article is republished from The Conversation under a Creative Commons license. Read the original article.
- Details
- Written by: LAKE COUNTY NEWS REPORTS

CLEARLAKE, Calif. — A Clearlake Police officer has been honored by Mothers Against Drunk Driving for his efforts to stop impaired driving in the city.
On Tuesday, Officer Daniel Eagle received MADD’s recognition award during the organization’s awards ceremony in Citrus Heights.
This award recognized Officer Eagle for his dedication to driving under the influence, or DUI, enforcement.
In 2022, Officer Eagle made 30 DUI arrests, officials said.
Police said the arrests helped to prevent the potential for traffic collisions and the unnecessary risk to citizens of the community and those traveling through it.
The Clearlake Police Department publicly thanked Eagle for his dedication and service to the community.
Eagle has been a valued member of the Clearlake Police Department since 2018.