 How to resolve AdBlock issue?
News
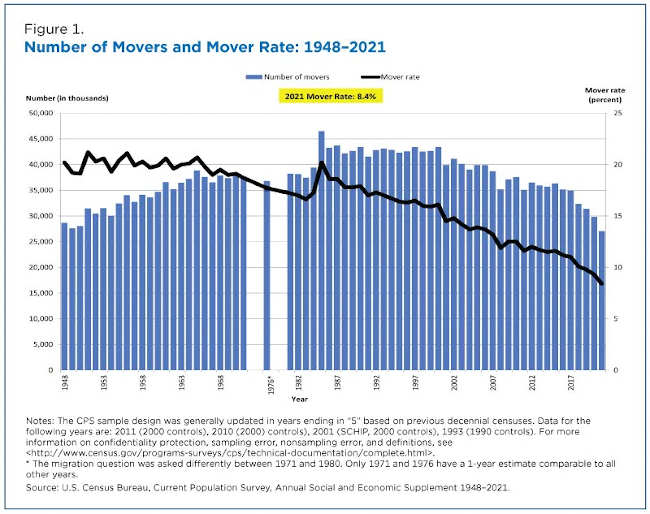
The COVID-19 pandemic did not stop a decline in the nation’s mover rate which in 2021 was at a new historical low over more than seven decades, according to the Current Population Survey Annual Social and Economic Supplement (CPS ASEC). The 2021 mover rate was less than half what it was in 1948.
In 2021, 8.4% of people lived in a different residence one year ago, down from 9.3% in 2020.
In the CPS ASEC, migration is measured as having a different residence one year prior to being interviewed from February to April. For example, 2021 CPS ASEC migration estimates captured people who changed residences from early 2020 to early 2021.
The 2020 and 2021 CPS ASEC migration estimates reflect different time periods relative to the COVID-19 pandemic. In the 2021 data, most possible moving days occurred during the pandemic, while in the 2020 data, most possible moving days occurred before the pandemic.
Moving slowdown
A falling mover rate is nothing new, and the pandemic did not disrupt this decline.
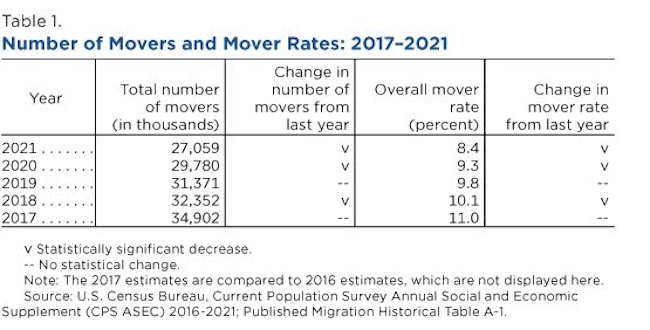
Over the past five years, both the annual mover rate and number of movers fell (from the previous year) in 2018, 2020, and 2021. (Neither the mover rate nor the number of movers changed statistically in 2017 or 2019). The number of movers declined in 2018, 2020, and 2021 despite continued U.S. population growth.
The 2021 mover rate decline is even more dramatic when compared to what it was more than seven decades ago.
In 1948, the first year the CPS collected this information, the mover rate was 20.2%, more than twice the 2021 mover rate (8.4%). The 2021 mover rate was lower than all prior mover rates from 1948 to 2020, marking a new historical low.
Aspects of migration stable between 2017 and 2021
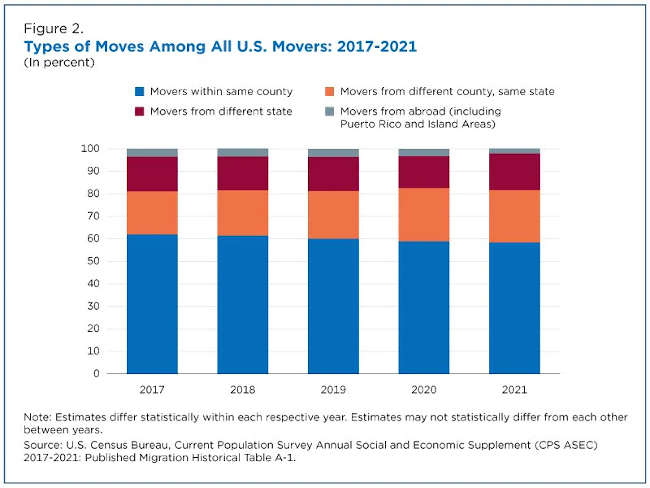
Even as the mover rate declined in recent years, other aspects of migration remained relatively stable, including types of moves, the main reason for moving and migration between regions.
In recent years, movers did not typically cross state or even county lines. In 2021, less than one-fifth moved from one state to another, while more than half moved within the same county. This was also the case in 2017 through 2020.
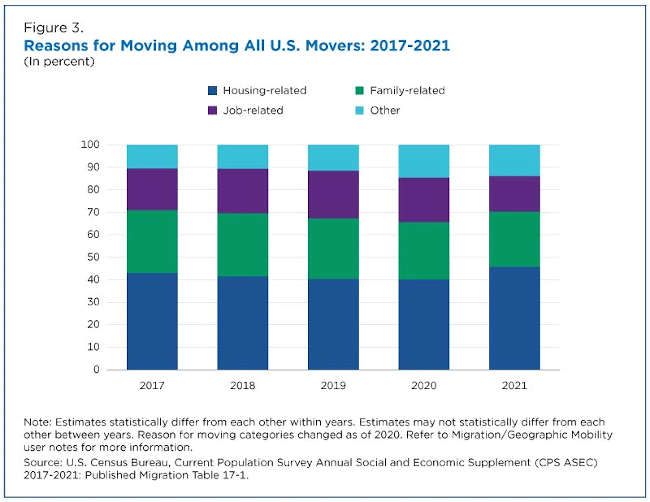
Nearly half of all movers in 2021 cited housing-related reasons for moving, which were also the most prevalent reasons given for moves from 2017 to 2021.
The next most prevalent reasons for moving in those years were family-related reasons, job-related reasons and, lastly, other reasons.
Moving across regions
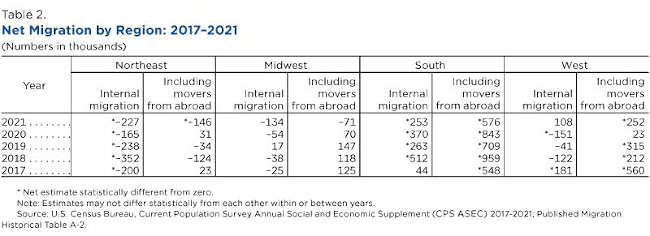
Across the four regions, net population changes associated with migration did not happen consistently or in the same direction in recent years.
In 2021, the South gained people from migration between regions, about 253,000, while the Northeast lost people, about 227,000. The Midwest and West did not experience statistically significant gains or losses.
In addition, the South experienced net internal gains in 2018 through 2020, and the Northeast also experienced net internal losses in 2017 through 2020.
Including movers from abroad, the South experienced net gains each year from 2017 through 2021 and the Northeast experienced a net loss in 2021.
Changes in migration from 2020 to 2021
The pandemic did not disrupt a decline in the national mover rate but it may have affected migration in other ways.
The relative share of movers crossing state lines increased from 2020 to 2021. At the same time, the share of movers from abroad declined, which may be related to international travel restrictions during the pandemic.
The relative share of movers indicating housing-related reasons increased from 2020 to 2021. At the same time, the share moving for job-related reasons declined, which may be linked to economic and workplace disruptions during the pandemic.
About the CPS ASEC migration estimates
The CPS ASEC migration estimates are among persons at least one year of age and living in the United States (50 states and District of Columbia). Movers from Puerto Rico and the U.S. Island Areas are counted as movers from abroad. As of 2020, there were changes to the survey’s reason for moving categories.
COVID-19-related changes to survey operations and nonresponse may have influenced 2020 and 2021 estimates.
More CPS ASEC migration estimates are available in our historical tables, historical graphs and annual detailed tables.
Definitions and more information about confidentiality protection, sampling error, and nonsampling error are available on the full CPS ASEC Technical Documentation page.
Kristin Kerns-D’Amore is a survey statistician in the Census Bureau’s Social, Economic, and Housing Statistics Division. Joey Marshall is a survey statistician in the Census Bureau’s Center for Economic Studies. Brian McKenzie is a branch chief in the Social, Economic, and Housing Statistics Division.

Public schools have been serving all students free meals since the COVID-19 pandemic first disrupted K-12 education. In March 2022, Congress rejected calls to keep up the federal funding required to sustain that practice and left that money out of a US$1.5 trillion spending package that President Joe Biden signed into law on March 11, 2022. We asked food policy expert Marlene Schwartz to explain why free meals make a difference and what will happen next.
How did the COVID-19 pandemic initially affect the school lunch program?
In March 2020, nearly all U.S. K-12 school buildings closed due to the COVID-19 pandemic.
The U.S. Department of Agriculture, which administers the federal government’s National School Lunch Program, quickly granted waivers to increase program flexibility and accommodate the challenges of the pandemic.
These waivers, which have been renewed several times, were critically important for school food service programs as the programs abruptly shifted away from serving meals in cafeterias and designed new distribution models to continue to feed students. Many school meal staff across the country created grab-and-go meals that families could pick up, which was particularly important in the spring of 2020 and the following school year. Another major change, which has continued during the 2021-2022 school year, is that school systems are able to serve meals to all students at no cost.
Prior to the COVID-19 pandemic, nearly 30 million lunches were served every school day to K-12 students through the National School Lunch Program. Schools provided roughly three-quarters of those meals at reduced rates or no cost at all – with the federal government reimbursing a portion of the cost of those meals.

How much money is involved?
The program cost $14 billion in 2019, before the pandemic disrupted it.
The price of a school lunch for families without free or reduced-cost meals varies. In 2017, full-price lunches tended to run between $2.50 and $2.75 apiece.
Are all public school students still getting free meals?
Yes. However, that will no doubt change once the latest waiver expires on June 30, 2022.
Advocates urged Congress to keep funding school nutrition programs at higher levels. But Congress did not include that money in the $1.5 trillion spending bill House and Senate lawmakers passed in March 2022.
This means that next fall, most schools will have to resume the old three-tiered system where some families don’t pay at all, some receive discounted lunches, and others must pay full price.
Two states will buck that trend. California and Maine will continue providing universal school meals after the federal waiver ends due to measures their state legislators passed and governors signed into law during the COVID-19 pandemic.
At the federal level, more than a dozen senators and roughly 50 members of the House of Representatives backed proposed legislation in 2021 that would permanently make school lunch free for all students, regardless of their income. There is significant support for this idea among advocates, but the future of this type of federal legislation remains to be seen.
What are the advantages of making school meals free to everyone?
In my view, the biggest advantage to universal school meals is that more students actually eat nutritious school meals. Following the regulations that emerged from the 2010 Healthy Hunger-Free Kids Act, the nutritional quality of school meals improved significantly, and a recent study found that schools typically provide the healthiest foods that children eat all day.
The research shows that making school meals free for everyone improves attendance and boosts diet quality. It also decreases the risk of food insecurity and the stigma associated with receiving a free meal. When no one has to pay, the growing problem of school meal debt is also eliminated.
There are important logistical benefits to universal school meals. Families don’t have to fill out any paperwork to establish their eligibility for free or reduced-price meals. And cafeteria staff can focus on serving the meals if they don’t need to track payments.
What’s wrong with charging some students for lunch again?
You have to look at the costs and benefits of the big picture. Universal school meals provide significant benefits to the school community as a whole – most notably, reductions in food insecurity and improvements in student diet quality. I believe these benefits are far greater than the marginal cost of providing free meals to students who would otherwise pay.
The fall of 2022 is also much too early to revert back to the three-tiered system because school food programs continue to face significant challenges. Supply chain disruptions have made it harder to buy some kinds of food, including chicken and whole grain products. In addition, many schools are having trouble hiring the staff they need to prepare and serve the meals, and inflation is increasing food costs.
What do you see happening in the future?
Ideally, the federal government will reconsider this issue and support universal school meals.
If that does not happen, advocates, policymakers and researchers will be watching what happens in California and Maine. We will be able to compare what happens in these states versus those that do not continue to provide all students with free meals. My hope is that this information will inform future decisions about implementing universal school meals for all students nationally.
[Over 150,000 readers rely on The Conversation’s newsletters to understand the world. Sign up today.]![]()
Marlene B. Schwartz, Professor of Human Development and Family Sciences, University of Connecticut
This article is republished from The Conversation under a Creative Commons license. Read the original article.
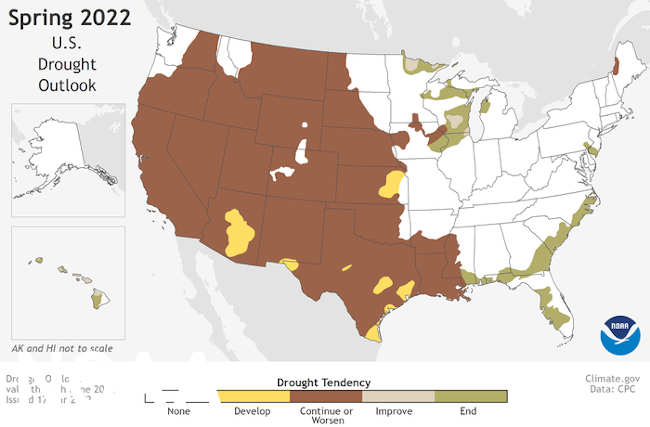
The National Oceanic and Atmospheric Administration, or NOAA, has issued its U.S. Spring Outlook and for the second year in a row, forecasters predict prolonged, persistent drought in the West where below-average precipitation is most likely.
NOAA’s Climate Prediction Center — part of the National Weather Service — is also forecasting above-average temperatures for most of the U.S. from the Desert Southwest to the East Coast and north through the Midwest to the Canadian border from April to June.
“NOAA’s Spring Outlook helps build a more weather and climate ready nation by informing local decision makers and emergency managers of this spring’s hazardous weather, such as extreme drought,” said NOAA Administrator Rick Spinrad, Ph.D. “NOAA’s seasonal outlooks provide advanced warning of the conditions to come, enabling communities to make preparations that boost their resilience to these hazards.”
Spring Outlook for drought, temperature and precipitation
“Severe to exceptional drought has persisted in some areas of the West since the summer of 2020 and drought has expanded to the southern Plains and Lower Mississippi Valley,” said Jon Gottschalck, chief, Operational Prediction Branch, NOAA’s Climate Prediction Center. “With nearly 60% of the continental U.S. experiencing minor to exceptional drought conditions, this is the largest drought coverage we’ve seen in the U.S. since 2013.”
Short-term drought recently developed in a region stretching from North Carolina southward through parts of Florida.
Dry conditions will bring an elevated risk of wildfires across the Southwest and southern Plains and north to the Central Plains, especially when high winds are present. Drought conditions in the Southwest are unlikely to improve until the late summer monsoon rainfall begins.
More than half of the U.S. is predicted to experience above-average temperatures this spring, with the greatest chances in the Southern Rockies and Southern Plains. Below-average temperatures are most likely in the Pacific Northwest and southeast Alaska.
Above-average precipitation is most likely in portions of the Great Lakes, Ohio Valley, mid-Atlantic and the west coast of Alaska, while below-average precipitation is forecast for portions of the Central Great Basin, Southwest, Central and Southern Rockies and Central and Southern Plains, eastward to the Central Gulf Coast.
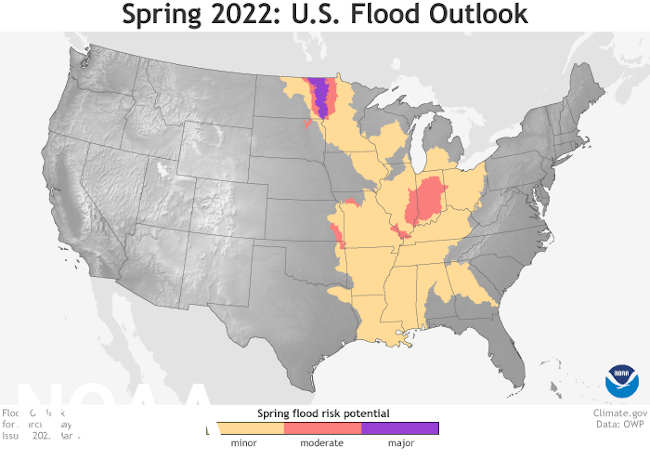
Spring flood risk
There is a minor-to-moderate flood risk throughout much of the eastern half of continental U.S., including the Southeast, Tennessee Valley, lower Mississippi Valley, Ohio Valley, and portions of the Great Lakes, upper Mississippi Valley, and middle Mississippi Valley. An above-normal ice breakup and flood potential is also present in Alaska.
“Due to late fall and winter precipitation, which saturated soils and increased streamflows, major flood risk potential is expected for the Red River of the North in North Dakota and moderate flood potential for the James River in South Dakota,” said Ed Clark, director, NOAA’s National Water Center.
Spring snowmelt in the western U.S. is unlikely to cause flooding.
NOAA’s National Hydrologic Assessment evaluates a number of factors, including current conditions of snowpack, drought, soil saturation levels, frost depth, streamflow and precipitation.
For detailed hydrologic conditions and forecasts, go to water.weather.gov.
Assembly Bill 132, the Postsecondary Education Trailer Bill, provides $100 million in one-time funding to help California community colleges provide comprehensive basic needs services to reduce equity and achievement gaps among traditionally underrepresented student populations across California.
According to the California Community Colleges Chancellor's Office, before the COVID-19 pandemic, approximately 50% of California community college students faced food insecurity, 60% faced housing insecurity and 19% faced homelessness within the past year.
A mid-pandemic survey, administered by the Student Senate for California Community Colleges indicated the pandemic exacerbated students’ basic needs insecurity: 67% of students reported higher levels of mental health distress and 40% reported dealing with a loss of income resulting in their inability to pay for housing expenses.
These needs, when unmet, easily and often lead to student crises and, without timely and significant intervention at an individual level, frequently leave students in extraordinarily difficult positions.
Often these students are forced into unfortunate and unnecessary choices, to address their crisis or to continue enrolling in classes to complete their educational journeys.
“Students shouldn’t have to worry about being able to afford their next meal,” said Janelle Meyers, Director of community relations and communication. “They cannot properly focus on their academics if they’re struggling with meeting their basic needs. The Basic Needs Department serves as a hub where students can feel safe and comfortable asking for resources that keep them moving towards their educational goals.”
To better support Mendocino College students, the Basic Needs Department will:
• Increase student access to nutritious and sufficient food.
• Connect students to resources to find safe, secure and adequate housing.
• Promote sustained mental and physical well-being and social-emotional support.
• Provide connections to affordable transportation assistance.
• Supply resources for personal hygiene care.
• Offer emergency funds.
• Deliver access to affordable and reliable internet access as well as technology devices.
Mendocino College has already begun laying the groundwork for a successful Basic Needs Department by:
• Adding staff capacity by creating a Basic Needs Liaison role to an office or team.
• Working closely with internal student support programs such as Financial Aid, Counseling, CalFresh Outreach, the college Food Pantry, and local community resources to ensure access to support in real-time.
• Establish clear pathways with instructions on navigating services to reduce barriers to accessing services.
• Creating an inviting webpage as a one-stop-shop for students experiencing challenges meeting their basic needs.
To learn more about the Mendocino College Basic Needs Department, visit www.mendocino.edu/basic-needs.
If you are part of a local organization that can offer basic needs assistance to Mendocino College students and would like to be added to the resource list, please contact Naoto Horiguchi at 707-467-1081.
Dogs available for adoption this week include mixes of Anatolian shepherd, Australian cattle dog, Australian Kelpie, Chihuahua, German shepherd, Great Pyrenees, husky, Jack Russell terrier, Labrador retriever, shepherd and pit bull.
Dogs that are adopted from Lake County Animal Care and Control are either neutered or spayed, microchipped and, if old enough, given a rabies shot and county license before being released to their new owner. License fees do not apply to residents of the cities of Lakeport or Clearlake.
The following dogs at the Lake County Animal Care and Control shelter have been cleared for adoption.
Call Lake County Animal Care and Control at 707-263-0278 or visit the shelter online for information on visiting or adopting.

Male husky mix
This 3-year-old male husky mix has a short black and white coat.
He is in kennel No. 6, ID No. LCAC-A-3152.

Male pit bull terrier
This 1-year-old male pit bull terrier has a short white and tan coat.
He is in kennel No. 7, ID No. LCAC-A-2821.

Female shepherd mix
This 5-year-old female shepherd mix has a tricolor coat.
She was in kennel No. 9, ID No. LCAC-A-2793.

Female shepherd mix
This 7-year-old female shepherd mix has a tricolor coat.
She was in kennel No. 10, ID No. LCAC-A-2792.

‘Annie’
“Annie” is a 1-year-old female Jack Russell terrier with a short white coat with brown markings.
She is in kennel No. 11, ID No. LCAC-A-3090.

‘Jingo’
“Jingo” is a 3-year-old male Labrador retriever with a short black coat.
He is in kennel No. 12, ID No. LCAC-A-2636.

Male Chihuahua
This 3-year-old male Chihuahua has a short tan coat.
He is in kennel No. 13a, ID No. LCAC-A-2992.

Male Chihuahua
This 2-year-old male Chihuahua has a short brown coat.
He is in kennel No. 13b, ID No. LCAC-A-2993.

Female Labrador retriever
This 4-year-old female Labrador retriever has a short black coat.
She is in kennel No. 14, ID No. LCAC-A-2694.

Australian cattle dog
This 3-year-old male Australian cattle dog has a black coat with tan markings.
He is in kennel No. 16, ID No. LCAC-A-3131.

‘Max’
“Max” is a 4-year-old male Australian Kelpie mix with a black and tan coat with white markings.
She is in kennel No. 18, ID No. LCAC-A-2852.

Female German shepherd
This 2-year-old female German shepherd has a black coat.
She is in kennel No. 19, ID No. LCAC-A-2844.

Female shepherd mix
This 1-year-old female shepherd mix has a short tricolor coat.
She is in kennel No. 20, ID No. LCAC-A-2843.

Male pit bull terrier
This 3-year-old male pit bull terrier has a short tan and white coat.
He is in kennel No. 21, ID No. LCAC-A-2948.

‘Barney’
“Barney” is a 3-year-old male retriever with a brown and black coat with white markings.
He is in kennel No. 23, ID No. LCAC-A-2856.

‘Blue’
“Blue” is a 4-year-old female husky with a gray and white coat, and blue eyes.
She is in kennel No. 25, ID No. LCAC-A-2816.

Anatolian shepherd-Great Pyrenees
This 2-year-old male Anatolian shepherd-Great Pyrenees has a short white coat.
He is in kennel No. 26, ID No. LCAC-A-2536.

Female pit bull terrier
This 2-year-old female pit bull terrier has a short black and white coat.
She is in kennel No. 33, ID No. LCAC-A-3085.

Male Australian cattle dog
This 3-year-old male Australian cattle dog has a short black, tan and white coat.
He is in kennel No. 34, ID No. LCAC-A-3130.
Email Elizabeth Larson at

Curious Kids is a series for children of all ages. If you have a question you’d like an expert to answer, send it to
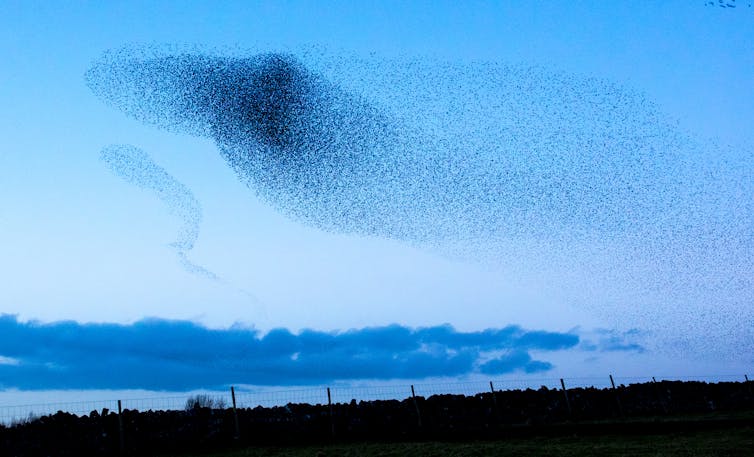
Why do flocks of birds swoop and swirl together in the sky? – Artie W., age 9, Astoria, New York
A shape-shifting flock of thousands of starlings, called a murmuration, is amazing to see. As many as 750,000 birds join together in flight. The birds spread out and come together. The flock splits apart and fuses together again. Murmurations constantly change direction, flying up a few hundred meters, then zooming down to almost crash to the ground. They look like swirling blobs, making teardrops, figure eights, columns and other shapes. A murmuration can move fast – starlings fly up to 50 miles per hour (80 kilometers per hour).
The European or common starling, like many birds, forms groups called flocks when foraging for food or migrating. But a murmuration is different. This special kind of flock is named for the sound of a low murmur it makes from thousands of wingbeats and soft flight calls.
Murmurations form about an hour before sunset in fall, winter and early spring, when the birds are near where they’ll sleep. After maybe 45 minutes of this spectacular aerial display, the birds all at once drop down into their roost for the night.
Why do starlings form murmurations?
Unlike the V formations of migrating geese, murmurations provide no aerodynamic advantage.
Scientists think a murmuration is a visual invitation to attract other starlings to join a group night roost. One theory is that spending the night together keeps the starlings warmer as they share their body heat. It might also reduce the chance an individual bird would be eaten overnight by a predator such as an owl or marten.
This dilution effect might be part of the reason murmurations happen: The more starlings in the flock, the lower the risk to any one bird of being the one that gets snagged by a predator. Predators are more likely to catch the nearest prey, so the swirling of a murmuration could happen as individual birds try to move toward the safer middle of the crowd. Scientists call this the selfish herd effect.
Of course, the more birds in a flock, the more eyes and ears to detect the predator before it’s too late.
And a gigantic mass of whirling, swirling birds can make it hard to focus on a single target. A falcon or hawk can get confused and distracted by tricky wave patterns in the murmuration’s movements. It also must be careful not to collide with the flock and get hurt.
Over 3,000 citizen scientist volunteers reported spotting murmurations in a recent study. A third of them saw a raptor attack the murmuration. That observation suggests that murmurations do form to help protect the birds from predators – but it’s also possible a huge murmuration would be what attracted a hawk, for instance, in the first place.
How do starlings coordinate their behavior?
Murmurations have no leader and follow no plan. Instead, scientists believe movements are coordinated by starlings observing what others around them are doing. Birds in the middle can see through the flock on all sides to its edge and beyond. Somehow they keep track of how the flock is moving as a whole and adjust accordingly.
To learn what’s happening inside murmurations, some researchers film them using many cameras at the same time. Then they use computer programs to track the movements of individual starlings and create 3D models of the flock.

The videos reveal that the birds are not as densely packed as they might appear from the ground; there is room to maneuver. Starlings are closer to their side neighbors than those in front or behind. Starlings on the edge frequently move deeper into the flock.
Mathematicians and computer scientists try to create virtual murmurations using rules that birds might follow in a flock – like moving in the same direction as their neighbor, staying close and not colliding. From these simulations, it seems that each bird must keep track of seven neighbors and adjust based on what they’re doing to keep the murmuration from falling apart in a chaotic mess. And they do all this while flying as fast as they can.
Large schools of fish can appear to behave like murmurations, as do groups of some swarming insects, including honeybees. All these synchronized movements can happen so fast within flocks, herds, swarms and schools that some scientists once thought it required animal ESP!
Biologists, mathematicians, physicists, computer scientists and engineers are all working to figure out how animals carry out these displays. Curiosity drives this research, of course. But it may also have practical applications too, like helping develop autonomous vehicles that can travel in tight formation and work in coordinated groups without colliding.
Hello, curious kids! Do you have a question you’d like an expert to answer? Ask an adult to send your question to
And since curiosity has no age limit – adults, let us know what you’re wondering, too. We won’t be able to answer every question, but we will do our best.![]()
Tom Langen, Professor of Biology, Clarkson University
This article is republished from The Conversation under a Creative Commons license. Read the original article.