 How to resolve AdBlock issue?
News

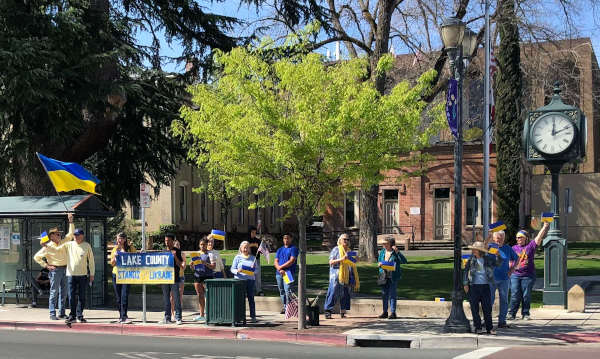
LAKEPORT, Calif. — Lake County answered the call from President Volodymyr Zelenskyy, who asked communities across the world to "come out of your offices" and homes and to gather "in your public squares" to show support for Ukraine.
On Saturday in Library Park in Lakeport, Lake County residents did just that.
Lakeport City Councilmember Michael Green handed out small Ukrainian flags to participants and distributed them to shops up and down main street.
People brought banners and a big Ukrainian flag which was waved to approve honks from drivers on Main Street.
It has been a full month since Russia invaded on Feb. 24. What was expected to be a rapid victory for Russia has turned into a stalemate as Ukrainian fighting forces and citizen volunteers have brought the giant Russian juggernaut to a standstill.
“The courage and resistance of the Ukrainian people has inspired the world,” said Deb Baumann of Upper Lake, one of the event’s organizers.
Baumann said people came from all over Lake County to show support.

The census conducted in the U.S. every 10 years is meant to count everyone. But it doesn’t actually count everyone.
After every census, the U.S. Census Bureau reports how well it did at counting every person in the country. In 2020, as in past years, the census didn’t get a completely accurate count, according to the bureau’s own reporting. The official census number reported more non-Hispanic whites and people of Asian backgrounds in the U.S. than there actually were. And it reported too few Blacks, Hispanics and Native Americans who live on reservations.
The Conversation U.S. asked Aggie Yellow Horse, a sociologist and demographer at Arizona State University, to explain why, and how, the census misses people, and how it’s possible to assess who wasn’t counted._
1. Who gets missed in the census?
The people most commonly missed are those with low income, people who rent or don’t have homes at all, people who live in rural areas and people who don’t speak or read English well. Often, these are people of color – Black Americans; Indigenous peoples; or people of Hispanic, Asian or Pacific Islander backgrounds.
Because of their living situations, these people can be hard for census takers to track down in the first place. And they may be more reluctant to participate because of concerns about confidentiality, fear of repercussions and distrust of government.
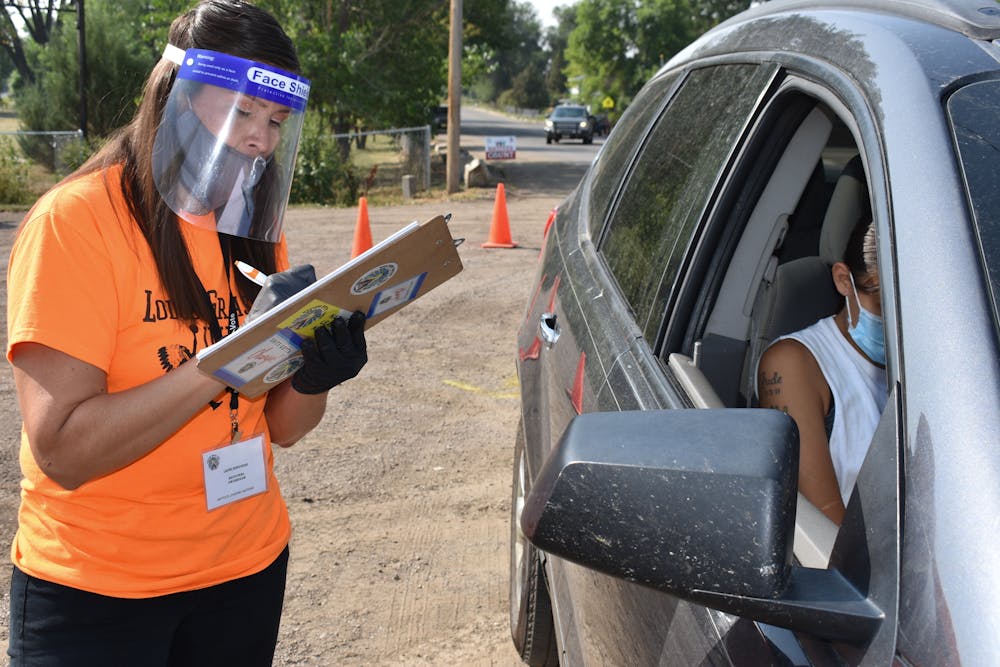
Nevertheless, the U.S. Census Bureau tries to count everyone, aiming targeted public relations campaigns at specific communities to encourage members to participate. In addition, Census Bureau employees knock on doors in person across the country, trying to follow up with those who did not respond to mailings, announcements and events.
However, the pandemic made that process more difficult for the 2020 census, both by making people uncomfortable with in-person visits and by shortening the timeline for collecting the data.
2. Who got missed?
The official estimates show that the 2020 census was really very accurate, capturing 99.8% of the nation’s residents overall. But the census missed counting 3.3% of Black Americans, 5.6% of American Indians or Alaskan Natives who live on reservations and 5% of people of Hispanic or Latino origin. This could mean missing about 1.4 million Black Americans; 49,000 American Indians or Alaskan Natives who live on reservations; and 3.3 million people of Hispanic or Latino origin.
This performance is much worse than in the previous two censuses, when smaller proportions of those populations were missed.
The 2020 census also counted 1.64% more non-Hispanic whites than there actually are in the country. For example, college students could have been counted twice – at their college residence and at their parents’ home.
3. How can they count the people who were missed?
It can be puzzling to understand how the Census Bureau can know how many people it missed. Efforts for measuring census accuracy started in 1940. Census officials use two methods.
First, the Census Bureau uses demographic analysis to create an estimate of the population. That means the bureau calculates how many people might be added to the population counts, through birth registrations and immigration records, and how many people might be removed from them, through death record or emigration reports. Comparing that estimate with the actual count can reveal an overall scale of how many people the census missed.
As a second measure, the Census Bureau runs what it calls a “post-enumeration survey,” taken after the initial census data is collected. The survey is conducted independent of the census and randomly sent to a small group of households from census blocks in each state, the District of Columbia and Puerto Rico. The results of that survey are compared with the census results for those households and can reveal how many people were missed, or if some people were counted twice or counted in the wrong place.
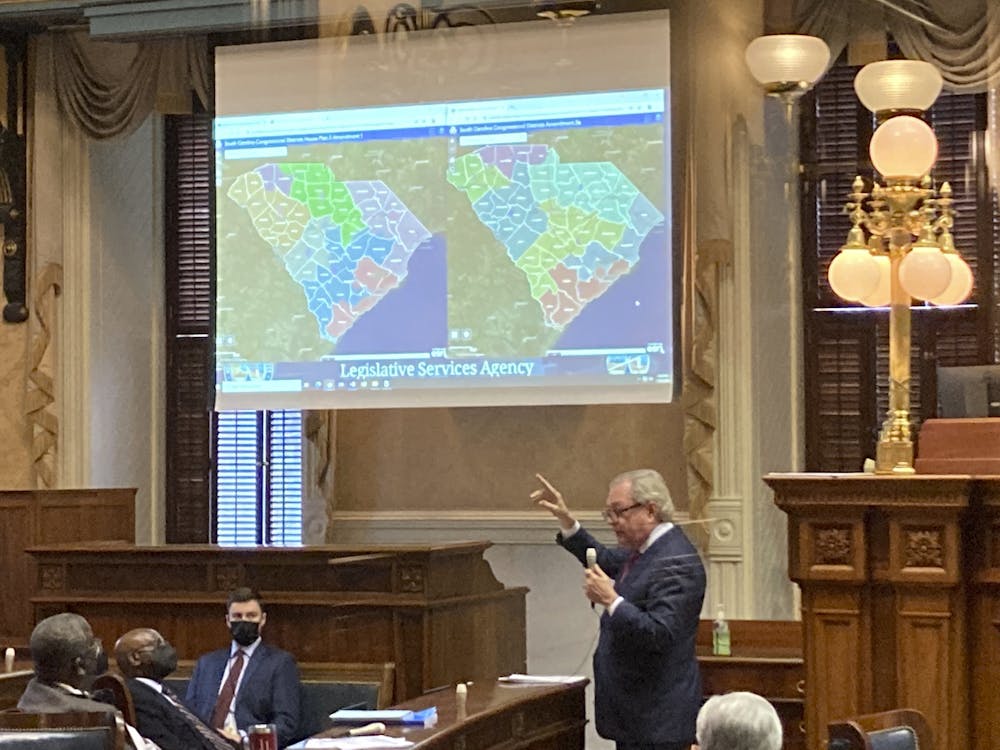
4. Can the Census Bureau fix its data?
The Census Bureau has determined that its 2020 data is not accurate and has measured the amount of that inaccuracy. But in 1999, the Supreme Court ruled that the bureau cannot adjust the numbers it sent to Congress and the states for the purpose of allocating seats in the U.S. House of Representatives and, therefore, Electoral College votes. That’s because federal law bars the use of statistical sampling in apportionment decisions and requires those changes to be made only on the basis of how many people were actually counted. That means political representation in Congress may not accurately reflect the constituencies the representatives serve.
But the numbers can be adjusted when used to divide up federal funding for essential services in communities around the nation. More than US$675 billion a year is provided to tribal, state and local governments proportionally according to their population numbers.
However, that adjustment happens only if tribal, state or local officials ask for it. The Census Bureau’s Count Question Resolution program can correct 2020 census data until June 2023. After the 2010 census, the program received requests from 1,180 governments, of out about 39,000 nationwide. As a result, about 2,700 people were newly added to the census count, and about 48,000 household addresses were corrected.
This approach can lessen the harm done to communities where the census count missed people. But it doesn’t prevent the Census Bureau from missing them – or others – in the next census.
[Get the best of The Conversation, every weekend. Sign up for our weekly newsletter.]![]()
Aggie Yellow Horse, Assistant Professor of Asian Pacific American Studies, Arizona State University
This article is republished from The Conversation under a Creative Commons license. Read the original article.
Dogs available for adoption this week include mixes of Anatolian shepherd, Australian cattle dog, Australian Kelpie, border collie, German shepherd, Great Pyrenees, husky, Labrador retriever, shepherd and pit bull.
Dogs that are adopted from Lake County Animal Care and Control are either neutered or spayed, microchipped and, if old enough, given a rabies shot and county license before being released to their new owner. License fees do not apply to residents of the cities of Lakeport or Clearlake.
The following dogs at the Lake County Animal Care and Control shelter have been cleared for adoption.
Call Lake County Animal Care and Control at 707-263-0278 or visit the shelter online for information on visiting or adopting.

Male pit bull terrier
This 1-year-old male pit bull terrier has a short white and tan coat.
He is in kennel No. 7, ID No. LCAC-A-2821.

Female shepherd mix
This 7-year-old female shepherd mix has a tricolor coat.
She was in kennel No. 10, ID No. LCAC-A-2792.

‘Jingo’
“Jingo” is a 3-year-old male Labrador retriever with a short black coat.
He is in kennel No. 12, ID No. LCAC-A-2636.

Female Labrador retriever
This 4-year-old female Labrador retriever has a short black coat.
She is in kennel No. 14, ID No. LCAC-A-2694.

Australian cattle dog
This 3-year-old male Australian cattle dog has a black coat with tan markings.
He is in kennel No. 16, ID No. LCAC-A-3131.

Male border collie
This young male border collie has a short black and white coat.
He is in kennel No. 17, ID No. LCAC-A-3207.

‘Max’
“Max” is a 4-year-old male Australian Kelpie mix with a black and tan coat with white markings.
She is in kennel No. 18, ID No. LCAC-A-2852.

Female German shepherd
This 2-year-old female German shepherd has a black coat.
She is in kennel No. 19, ID No. LCAC-A-2844.

Female shepherd mix
This 1-year-old female shepherd mix has a short tricolor coat.
She is in kennel No. 20, ID No. LCAC-A-2843.

Male pit bull terrier
This 3-year-old male pit bull terrier has a short tan and white coat.
He is in kennel No. 21, ID No. LCAC-A-2948.

‘Kimber’
“Kimber” is a 1-year-old female pit bull terrier with a short red and white coat.
She is in kennel No. 22, ID No. LCAC-A-2957.

‘Barney’
“Barney” is a 3-year-old male retriever with a brown and black coat with white markings.
He is in kennel No. 23, ID No. LCAC-A-2856.

‘Blue’
“Blue” is a 4-year-old female husky with a gray and white coat, and blue eyes.
She is in kennel No. 25, ID No. LCAC-A-2816.

Anatolian shepherd-Great Pyrenees
This 2-year-old male Anatolian shepherd-Great Pyrenees has a short white coat.
He is in kennel No. 26, ID No. LCAC-A-2536.

Female border collie
This young female border collie mix has a short brindle and white coat.
She is in kennel No. 27, ID No. LCAC-A-3209.

Male Doberman pinscher mix pup
This male Doberman pinscher mix puppy has a short tan coat.
He is in kennel No. 31, ID No. LCAC-A-3210.

Female pit bull terrier
This 2-year-old female pit bull terrier has a short black and white coat.
She is in kennel No. 33, ID No. LCAC-A-3085.

Male Australian cattle dog
This 3-year-old male Australian cattle dog has a short black, tan and white coat.
He is in kennel No. 34, ID No. LCAC-A-3130.
Email Elizabeth Larson at
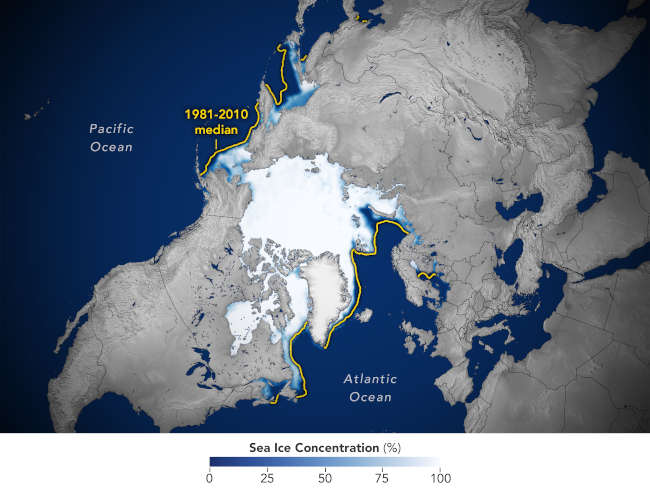
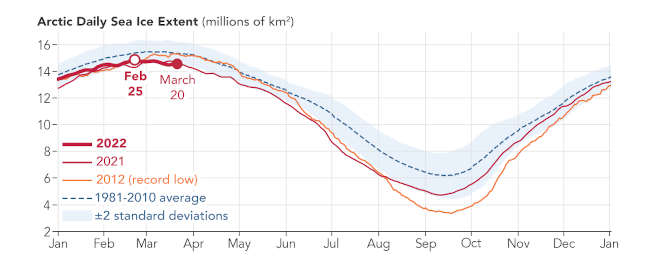
Arctic sea ice appeared to have hit its annual maximum extent on Feb. 25 after growing through the fall and winter.
This year’s wintertime extent is the 10th-lowest in the satellite record maintained by the National Snow and Ice Data Center, one of NASA’s Distributed Active Archive Centers.
Arctic sea ice extent peaked at 5.75 million square miles and is roughly 297,300 square miles below the 1981-2010 average maximum — equivalent to missing an area of ice slightly larger than Texas and Maine combined. This maximum ties with 2015 as the third earliest on record.
Sea ice waxes and wanes with the seasons every year. In the Arctic, it reaches its maximum extent around March after growing through the colder months, and shrinks to its minimum extent in September after melting through the warmer months. In the Southern Hemisphere, Antarctic sea ice follows an opposite cycle.
To estimate sea ice extent, satellite sensors gather sea ice data that are processed into daily images, each image grid cell spanning an area of roughly 15 miles by 15 miles (25 kilometers by 25 kilometers). Scientists then use these images to estimate the extent of the ocean where sea ice covers at least 15% of the water.
Since satellites began reliably tracking sea ice in 1979, maximum extents in the Arctic have declined at a pace of about 13% per decade, with minimum extents declining at about 2.7% per decade.
These trends are linked to warming caused by human activities such as emitting carbon dioxide, which traps heat in the atmosphere and causes temperatures to rise. NASA’s analysis also shows the Arctic is warming about three times faster than other regions.
This February, Antarctic sea ice dropped to a record-low minimum extent. But unlike in the Arctic, this sea ice has shown irregular ups and downs mainly because of the geographical features that surround it. Winds and ocean currents specifically linked to the Southern Ocean and Antarctica have a strong influence on sea ice extent.
Sea ice in the Arctic is surrounded by land, whereas sea ice in the Antarctic is surrounded only by ocean and can thus spread out more freely. Overall, the Antarctic sea ice record shows a slightly upward — but nearly flat — trend or increase.
Gains in Antarctic sea ice are not large enough to offset the losses of the Arctic. The ice in both regions helps regulate global temperatures. Even if Antarctic gains balanced sea ice levels globally, Arctic sea ice losses could still contribute to further regional and global warming.
Roberto Molar Candanosa works for NASA’s Goddard Space Flight Center in Greenbelt, Maryland.
The state’s unemployment rate for February was 5.4%, down from the revised rate of 5.7% in January, with employers adding 138,100 nonfarm payroll jobs to the economy, according to data released by the California Employment Development Department.
The Employment Development Department said California’s 138,100 new jobs in February far outpaced every other state, and it was 60,300 more jobs than the next closest state of Texas and 87,100 more jobs than Florida.
The federal Bureau of Labor Statistics said the nationwide jobless rate in February was 3.8%, down from 4% in January and 6.2% in February 2021.
In Lake County in February, the jobless rate was 5.9%, down from an adjusted rate of 6.8% in January, according to the data. The February 2021 rate was 9.2%.
In February, almost all of Lake County’s job sectors added jobs, led by total farm, which was up by 39.4% percent, or 260 jobs, followed by a 12.5% increase in the information sector and 11.1% for wholesale trade.
Overall, Lake County added 430 jobs in February, the Employment Development Department reported.
California has now regained 87.2% — or 2,405,900 — of the 2,758,900 nonfarm jobs lost during March and April of 2020 due to the COVID-19 pandemic.
Since January 2021, California has created more than 1.3 million jobs, the state reported.
“These latest numbers show that California is continuing to drive our nation’s job growth,” said Gov. Gavin Newsom. “We’re doing it by promoting more pathways to opportunity and embracing the diversity, creativity, innovation, and determination that breeds success — building a California for all.”
Of the 678,000 jobs the nation gained in February, California accounted for 20.4% of them. The state’s year-over job growth of 6.8% also outpaced the nation’s rate of 4.6%.
The report showed that California has enjoyed month-over gains in nonfarm jobs in 12 of the past 13 months, averaging roughly 101,700 jobs gained per month over that time.
Email Elizabeth Larson at
The event will take place on Saturday, May 7, from 9 a.m. to 4 p.m. at the Lake County Fairgrounds.
The faire takes a walk back in time to the Renaissance era with costume, theater, games, activities, food and song. Guests will enjoy Shakespearean plays presented by nearly 100 KCA students.
“Each year our children and faculty pour a great deal of love and effort into planning the Renaissance Faire Fundraiser. The event has become a great point of pride for our school, and we are excited to share it again with our community,” KCA Principal Meredith Wiser explained.
The Renaissance Faire fundraiser includes music, live and silent auction, booths, feasting fit for a king, activities for the entire family, live performances and so much more.
Ticket prices range from $10 to $45 and sponsorships are available. To purchase tickets, become a sponsor or to make a donation, visit Eventbrite, KCA’s Facebook page, or at KCA by calling 707-262-1522.
Konocti Christian Academy is a 501(c)(3) non-profit and donations are tax-deductible.