 How to resolve AdBlock issue?
News
The U.S. national poverty rate declined significantly to 12.5% during the 5-year period from 2018 to 2022, according to American Community Survey, or ACS, 5-year estimates.
The rate was down from 14.6% during 2013-2017, the most recent nonoverlapping 5-year period.
Comparing the 2013-2017 and 2018-2022 5-year estimates offers a longer-term look at national and local economic trends.
The ACS 5-year estimates differ from the 1-year estimates released in September because they pool five consecutive years of 1-year ACS data, allowing Census Bureau researchers to estimate poverty rates for areas with smaller populations and all 3,144 U.S. counties.
How poverty is measured
Poverty status is determined by comparing annual income to a set of dollar values (called poverty thresholds) that vary by family size, number of children and the age of the householder.
If a family’s before-tax money income is less than the dollar value of their threshold, that family and every individual in it are in poverty. For people not living in families, poverty status is determined by comparing the individual’s income to their poverty threshold.
The poverty measure excludes children under age 15 not related to the householder and people living in institutional group quarters, college dormitories or military barracks.
The poverty rates in this article are based on the official poverty measure and are different from the Supplemental Poverty Measure, or SPM.
The SPM differs in a number of key ways such as the factoring in of additional resources and expenses not included in the official poverty measure as well as geographic variation in poverty thresholds.
County poverty rates
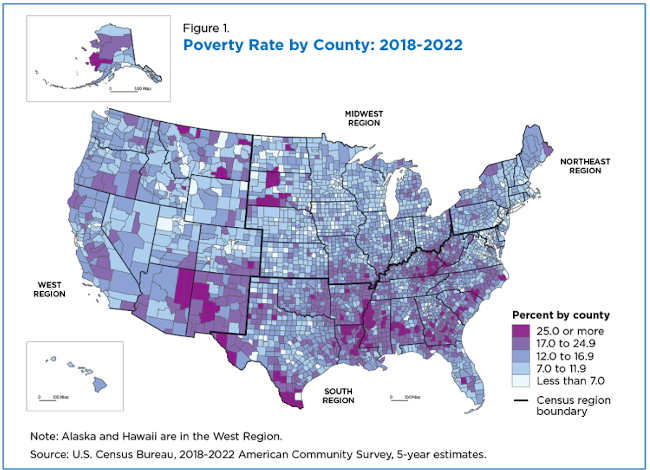
During the 2018-2022 period, county poverty rates ranged from 1.6% to 55.8% (Figure 1).
Counties with the lowest poverty rates in 2018-2022 included: Borden County, Texas (1.6%); Morgan County, Utah (1.7%); Sterling County, Texas (1.8%); Falls Church independent city (considered a county equivalent), Virginia (2.3%); McCone County, Montana (2.4%); Kenedy County, Texas (2.6%); Douglas County, Colorado (3.0%); and Stanley County, South Dakota (3.2%) among others. These estimates are not significantly different from one another at the 90% confidence level.
Three counties in South Dakota – Oglala Lakota County (55.8%), Todd County (52.2%) and Mellette County (49.1%) – were among those with the nation’s highest poverty rates. All three are in the western part of the state and are home to American Indian reservations. These estimates were not significantly different from one another at the 90% confidence level.
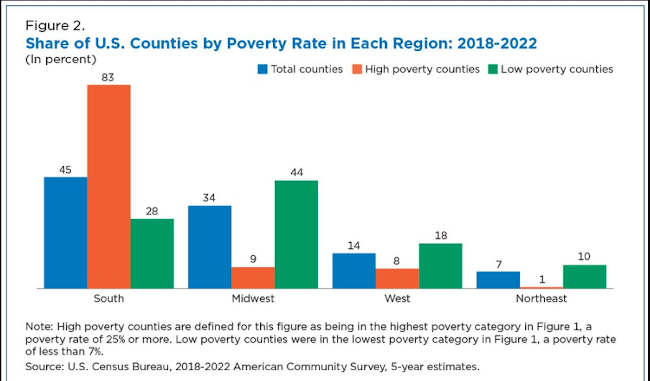
Figure 2 shows the share of total counties per census region along with the percentage of counties in the high and low map categories. The total counties category indicates the percentage of U.S. counties in the region.
Of the 172 counties in the highest poverty category (poverty rates of 25% or more), 142 (more than 80%) were in the South, compared to 45% of total counties.
The 219 counties in the lowest poverty category (poverty rates of less than 7.0%) were more evenly dispersed around the nation. Approximately 44% were in the Midwest, compared to 34% of total counties; 28% were in the South.
Just less than 10% of all counties in the South were in the high poverty category. No other region had more than 3.1% of its total counties with poverty rates of 25% or more. The four regions had a range of 4.4% (South) to 9.6% (Northeast) of its counties in the low poverty category.
Change from last five-year period
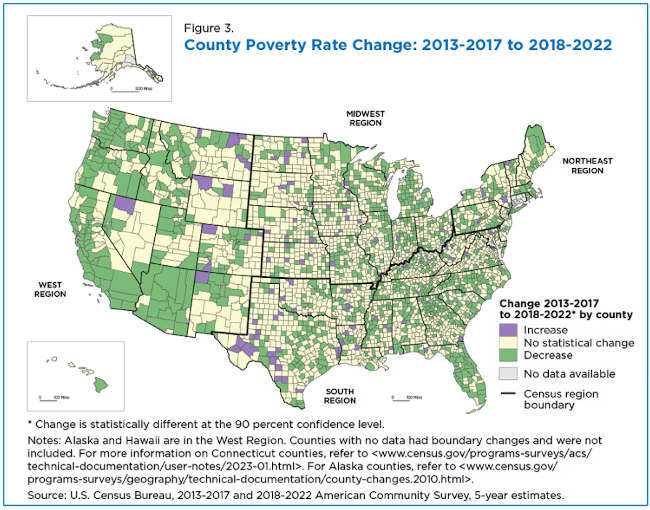
Changes in county poverty rates from the last 5-year period (2013-2017) to the most recent (2018-2022) show where and what economic changes have occurred over a longer period.
The national poverty rate decreased 2.0 percentage points to 12.5% and 1,144 counties — more than 36% — had a significant change in poverty rates (Figure 3).
Poverty rates decreased in more than one-third (1,042) of all counties. Only 102 counties experienced an increase in poverty rates compared to 2013-2017. It should be noted that counties that have had geographic changes over this period were not used in the comparison and are identified in Figure 3 as counties with no data available.
Where did changes occur?
Of the 1,042 counties that had lower poverty rates in the recent time period (2018-2022) 466 were in the South, 303 in the Midwest, 191 in the West and 82 in the Northeast.
In the West, 42.7% of all counties had lower poverty rates, while in the Northeast poverty rates decreased in 39.2% of all counties, 32.8% in the South and 28.7% in the Midwest.
Among the counties where poverty rates increased, 49.0% were in the South and 30.4% in the Midwest. There was less of a regional difference where poverty increased. In all regions, between 2.9% and 3.5% of counties experienced poverty rate increases from the 2013-2017 to 2018-2022 period.
Craig Benson is a survey statistician in the Census Bureau’s Poverty Statistics Branch.
The meeting will begin at 4 p.m. at the Moose Lodge, located at 15900 Moose Lodge Lane in Clearlake Oaks.
The meeting will be available via Zoom. The meeting ID is 830 2978 1573, pass code is 503006.
On Wednesday ERTH will discuss the general plan and Shoreline Area Plan update.
Other agenda items include an update on the Clearlake Oaks Consolidated Lighting District update, crosswalk safety at East Lake School and Highway 20, Spring Valley, commercial cannabis and the Cannabis Ordinance Task Force, and reports from Northshore Fire Protection District Chief Mike Ciancio and Supervisor EJ Crandell.
ERTH’s next meeting will take place on May 1.
ERTH’s members are Denise Loustalot, Jim Burton, Tony Morris and Pamela Kicenski.
For more information visit the group’s Facebook page.
Lake County 2050 will guide county decisions on land use, circulation, safety, natural resources, environmental justice and other important topics through the year 2050.
In the first round of community workshops, participants will learn more about the project and discuss key issues in each local area plan planning area.
A community workshop will be held for each area plan, hosted by the established town hall or advisory group in that area, or by county staff. In-person meetings will feature small group discussions and Spanish translation will be available.
The schedule for that first round of meetings, with information on locations, dates, times and Zoom access, is below.
Upper Lake/Nice: Western Region Town Hall
Monday, April 8, 5:30 p.m.
Habematolel Pomo Tribal Room, 9460 Main St., Upper Lake
https://lakecounty.zoom.us/j/82078005751?pwd=QTN0Q1hjL3RaZ25KaVpTZkpxVGJrdz09
Webinar ID: 820 7800 5751
Passcode: 194444
Shoreline Communities 1, Central Regional Town Hall
Tuesday, April 9, 6 p.m.
Lucerne Alpine Senior Center, 3985 Country Club Drive
https://us06web.zoom.us/j/8095875486?pwd=MzROLzQwMTMycC9BbzZlOEZMRFJ5UT09&omn=85275775132
Meeting ID: 809 587 5486
Passcode: 550381
Lower Lake, Lower Lake Community Action Group
Wednesday, April 10, 5:30 p.m.
Clubhouse at Russell Rustici Park, 16375 Second St.
https://us06web.zoom.us/j/8095875486?pwd=MzROLzQwMTMycC9BbzZlOEZMRFJ5UT09&omn=83695921846
Meeting ID: 809 587 5486
Passcode: 550381
Middletown, Middletown Area Town Hall
Thursday, April 11, 6 p.m.
Middletown Community Center (Community Meeting Room), 21256 Washington St.
https://us06web.zoom.us/j/86918245695?pwd=hrcKzh0BrlKg88SDVZfjjwLxnUlErH.1
Meeting ID: 869 1824 5695
Passcode: 808449
Rivieras, Kelseyville Riviera Homeowners Association
Monday, April 15, 6 p.m.
Kelseyville Riviera Community Association office, 9689 State Highway 281 (next to Artis Café)
https://us06web.zoom.us/j/8095875486?pwd=MzROLzQwMTMycC9BbzZlOEZMRFJ5UT09&omn=85445534568
Meeting ID: 809 587 5486
Passcode: 550381
Kelseyville, Big Valley Advisory Committee (in formation)
Wednesday, April 17, 6 p.m.
Kelseyville Senior Center, 5245 Third St.
https://lakecounty.zoom.us/j/88608683856?pwd=NmFhQmQvbVJLdWpaby9ZN2ZHbnJ0dz09
Webinar ID: 886 0868 3856
Passcode: 752358
Cobb Mountain, Cobb Area Council
Thursday, April 18, 6 p.m.
Little Red Schoolhouse, 15780 Bottle Rock Road, Cobb
https://us06web.zoom.us/j/83230383747?pwd=WSCbCNmCFxt9qD31xgaYAPxUOK4oBs.1
Meeting ID: 832 3038 3747
Passcode: 672104
Lakeport, Scotts Valley Community Advisory Council
Monday, April 22, 5:30 p.m.
Lake County Board of Supervisors chambers, 255 N. Forbes St., first floor, Lakeport
https://lakecounty.zoom.us/j/86572838721?pwd=TXVhUktDTkZrVXVEUXUybm5QSzd4QT09
Webinar ID: 865 7283 8721
Passcode: 238904
Shoreline Communities 2, East Region Town Hall
Wednesday, May 1, 4 p.m.
*Abbreviated meeting. No breakout groups or Spanish interpretation
Clearlake Oaks Moose Lodge, 15900 Highway 20, Clearlake Oaks
https://us06web.zoom.us/j/83029781573?pwd=KZYEE4bdvQ2Oh81VAFaCMSqOVylXec.1
Meeting ID: 830 2978 1573
Passcode: 503006
Thompson introduces this resolution each year to mark March as Women’s History Month and celebrate the diverse history of our country’s women.
The theme of National Women’s History Month 2024 is “Women Who Advocate for Equity, Diversity and Inclusion.”
The resolution resolves that, “The House of Representatives (1) supports the goals and ideals of National Women’s History Month; (2) recognizes and honors the women and organizations in the United States that have fought for, and continue to promote, the teaching of women’s history and the women’s suffrage movement; and (3) recognizes and honors the unique intersectional experiences of Black, Hispanic, Asian, Hawaiian, Pacific Islander, and Native American, and LGBTQ+ women and women with disabilities in the United States throughout history, the women’s suffrage movement and in the ongoing fight for equality.”
“Every year, we come together to highlight the extraordinary contributions of women throughout our nation’s history and the continued need to push for equality,” said Thompson. “The history of America cannot be told without women’s history. Women’s History Month, which originated in our district, provides an opportunity to highlight the incredible contributions of American women. I am proud to introduce this resolution every year to elevate the stories of women from our nation’s history.”
“Each March, we celebrate and honor the trailblazing women who have fought for a better future for women everywhere,” said Chair Frankel. “In every field — from medicine and math, to education and politics — women have often led the charge in pushing America forward and advancing the ideals of equity and justice for all. As we reflect on their legacy, we take inspiration to continue our fight for women’s equality. They never backed down and neither will we.”
Until the late 1970’s, women’s history was rarely included in K-12 curriculum and was virtually absent in public awareness.
To counter this, the Education Taskforce of the Sonoma County Commission on the Status of Women initiated a “Women’s History Week” celebration in 1978 centered on International Women’s History Day.
With the help of the National Women’s History Project, founded in Sonoma County, thousands of schools and communities joined in the commemoration of Women’s History Week.
In 1981, Congress responded to the growing popularity of Women’s History Week by making it a national observance and eventually expanding the week to a month in 1987.
The National Women’s History Project is based in Santa Rosa and chooses the theme of National Women’s History Month each year.
This year, National Women’s History Month celebrates “Women Who Advocate for Equity, Diversity and Inclusion.”
The resolution was cosponsored by 53 members of Congress.
The text of the resolution is published below.
thomca_054_xml by LakeCoNews on Scribd
Dogs available for adoption this week include mixes of Alaskan husky, American blue heeler, Anatolian shepherd, border collie, Chihuahua, German shepherd, Great Pyrenees, Labrador Retriever, pit bull terrier and Rottweiler.
Dogs that are adopted from Lake County Animal Care and Control are either neutered or spayed, microchipped and, if old enough, given a rabies shot and county license before being released to their new owner. License fees do not apply to residents of the cities of Lakeport or Clearlake.
Those dogs and the others shown on this page at the Lake County Animal Care and Control shelter have been cleared for adoption.
Call Lake County Animal Care and Control at 707-263-0278 or visit the shelter online for information on visiting or adopting.
The shelter is located at 4949 Helbush in Lakeport.
Email Elizabeth Larson at


Travel nurses take short-term contracts that can require long commutes or temporarily living away from home. Time and again, they have to get used to new co-workers, new protocols and new workplaces.
So why would staff nurses quit their stable jobs to become travel nurses?
Well, for one, they get bigger paychecks. But U.S. nurses have other rationales besides making more money, according to a study I conducted.
To do this research, I interviewed 27 registered nurses based in different places.
Many of the people I interviewed disclosed that they left permanent positions to combat burnout. Although they welcomed the bump in pay, travel nursing also gave them the autonomy to decide when and where to work. That autonomy allowed them to pursue personal and professional interests that were meaningful to them, and it made some of the other hassles, such as long commutes, worth it.
On top of earning more money, travel nursing “gives you an opportunity to explore different areas,” said a nurse I’ll call Cynthia, because research rules require anonymity. “When you actually live there for three months, it gives you a chance to really immerse yourself in the area and really get to know not just the touristy stuff, but really hang out with the locals and really be exposed to that area.”
Other study participants said they enjoyed the novelty and educational opportunities.
“You don’t get bored or stuck in a routine,” Michelle said. “You’re always trying to learn new policies at the new hospital that you’re in, learning about the new doctors, nursing staff, new ways of doing things, where things are located. That helps keep me from feeling burned out so quickly.”
Said Patricia: “I want to see how other operating rooms across the country do things and how they do things differently. I do learn a lot of things going from place to place.”

Why it matters
A growing number of U.S. nurses were obtaining temporary assignments before the COVID-19 pandemic began.
But travel nursing became much more widespread in 2020, when hospitals were scrambling to keep their staffing levels high enough as millions of Americans were becoming infected with the coronavirus, straining capacity in many communities.
While compensation varies widely, the median pay of registered nurses in 2022 was US$81,220, about 35% less than the $110,000 that registered nurses who traveled earned.
At the height of the COVID-19 pandemic, travel nurses could earn an even bigger premium. Many were paid twice as much as staff nurses.
Once the number of Americans with severe symptoms fell, that premium declined too. But there are still over 1.7 million travel nurses in the U.S. Hiring them is one of the main ways that hospitals cope with a long-term shortage of nurses.
But nurses with permanent jobs can get aggravated by this arrangement when they learn how much more travel nurses earn for doing the same work, as I found through another research project.
What other research is being done
Research supports a widely reported trend: More Americans have temporary jobs and freelance employment than in the past.
While travel nurses can help hospitals, nursing homes and doctors’ offices meet staffing needs, there are signs that patients don’t always fare as well with their care.
And a Canadian study found that when hospitals let staff nurses work part time and offer other alternative arrangements, their retention rates may rise.
The Research Brief is a short take about interesting academic work.![]()
Ivan Gan, Assistant Professor of Communication Studies, University of Houston-Downtown
This article is republished from The Conversation under a Creative Commons license. Read the original article.