 How to resolve AdBlock issue?
News

The Mars Helicopter is a technology demonstration for the Mars 2020 rover mission, intended to show the feasibility and utility of using helicopters for Mars exploration.
This technology may enable future missions to perform reconnaissance or independent science, and to access terrain not reachable by rovers and astronauts.
When NASA’s next Mars rover sets out for the Red Planet in 2020, it will bring along a passenger. Nestled under the belly of the rover, the Mars Helicopter will be on a mission to notch a “first” for humankind: flying a helicopter on another planet.
By sending the helicopter to Mars as a technology demonstration, NASA aims to expand its exploration capabilities to include an aerial dimension, potentially opening new areas to exploration, and enabling faster reconnaissance for the benefit of future rovers or astronauts.
With a four-foot rotor and a weight of only four lbs, the Mars Helicopter’s unique design is driven by the harsh realities of the Mars environment.
The Martian atmosphere is extremely thin and cold; at only 1 to 2 percent, the density of sea-level air and with temperatures down to -130˚ F, it resembles Earth’s atmosphere at 100,000 feet – an altitude far beyond the capabilities of regular helicopters.
To make the Mars Helicopter a reality, researchers from NASA’s Jet Propulsion Laboratory, NASA Ames Research Center, NASA Langley Research Center and AeroVironment Inc., worked together over several years to understand the unique challenges of flying on Mars, and to develop a viable vehicle design that is part aircraft and part spacecraft.
A crucial aspect of the design is to keep the mass as low as possible, but to carry enough power and energy to sustain the helicopter during flight. Recent technological advances in areas such as batteries and solar cells, miniaturized sensors and computers, and lightweight materials are key to achieving this goal.
Many components of the Mars Helicopter were developed for the commercial cell phone and drone markets. They were qualified for the Mars Helicopter mission through testing in Mars-like temperatures and by subjecting them to radiation levels that would be experienced in space.
The Mars Helicopter is designed to operate independently on Mars, performing flights of about 90 s in duration at a height of 16 feet. The two rotors spin in opposite directions at approximately 2500 revolutions per minute.
Between flights, the helicopter recharges its batteries using an onboard solar panel. A 12-Megapixel camera takes pictures during flight, which are beamed back to the rover for relay to Earth. During the cold Martian nights, the batteries and sensitive electronics are kept warm inside a heated and insulated fuselage.
During flight the helicopter must navigate with full autonomy, unassisted by humans and without GPS or other navigation aids.
Jet Propulsion Laboratory researchers developed a vision-based navigation system for the helicopter, which analyzes camera images and combines the information with measurements from an inertial measurement unit and an altimeter to keep track of the helicopter’s position, velocity, and attitude.
To develop the control system for the helicopter, the team performed extensive modeling and simulation, as well as low-density experiments, to determine how the thin atmosphere would affect the response of the helicopter to control inputs, wind and gusts.
The team’s “Wright brothers’ moment” came in May 2016, when controlled flight was achieved with a test vehicle inside the Jet Propulsion Laboratory’s Twenty-Five-Foot Space Simulator, a large vacuum chamber where the conditions of the Martian atmosphere were replicated.
In 2018, tests were performed with emulated Martian winds, produced using nearly 900 fans. Furthermore, the Mars Helicopter Flight Model, which will be sent to Mars, was built and tested, before performing its maiden hover flight in early 2019.
It will now be integrated with the rover and await the chance to fly again – this time on Mars.

CLEARLAKE, Calif. – A three-vehicle crash in Clearlake on Thursday afternoon left several people injured.
The crash occurred shortly before 3:30 p.m. in the 14000 block of Lakeshore Drive, in front of Highlands Park, according to radio reports.
One of the vehicles rolled onto its top and the wreck completely blocked the roadway, police reported.
There also was one person trapped with a possible head injury, with incident command requesting over the radio that an air ambulance respond.
Altogether, incident command reported that there were two people with minor injuries, one with moderate injuries and one with major injuries.
Shortly after the crash, the Clearlake Police Department issued a Nixle alert reporting that Lakeshore Drive was closed between Palmer and Alvita avenues due to the wreck.
A REACH air ambulance responded to Adventist Health Clear Lake to transport the person with major injuries, based on radio traffic.
An update on the person who was flown out was not immediately available from police.
Later on Thursday afternoon, police asked over the radio for city public works staff to respond to nearby Highlands Park due to damage to a pole and other equipment.
Email Elizabeth Larson at
LAKEPORT, Calif. – The Lake County Horse Council is launching a new event, the Jamboree Weekend.
Beginning Friday, Jan. 17, at Fritch Hall in the Lake County Fairgrounds in Lakeport, the Country Jamboree – Barbeque Dinner will offer an evening of delicious food and great music with the dinner proceeds benefiting the Lake County Horse Council and Westside Community Horse Park.
Happy hour takes place from 5 to 6 p.m., with dinner from 6 to 9 p.m.
Enjoy a barbecue tri-tip and chicken dinner catered by Lakeview Market along with live music from the fantastic Tom Drinnon, best known for his authentic country sound and versatile range.
Born in Lakeport, Drinnon moved to Nashville at the young age of 23 and was immediately signed with a major management company. From there he went out on the road performing across the nation with many well-known country artists including Carrie Underwood, Randy Travis, Vince Gill, and Tim McGraw, to name a few.
Tickets are $45 per person or $400 for a table of eight – which includes wine, appetizers and a personal server – and can be purchased from Eventbrite through the Lake County Horse Council Facebook page.
The fun continues from 2 to 8 p.m. on Saturday, Jan. 18, when the Horse Council hosts its fourth annual January Jamboree – Equine & Wine, a horse expo and entertainment event at Fritch Hall.
The January Jamboree networks local equestrians with businesses, events and vendors as well as providing educational information for children and adults alike.
The free event will feature food and drinks, wine tasting, tack swap, a raffle and live music with Tom Drinnon.
Vendors will include multiple different horse groups and clubs, boarding and training facilities, tack stores and local businesses. Vendor space is available; the cost is $45 for a 10-foot by 10-foot space.
The Lake County Horse Council’s mission is to support the horse industry in Lake County.
The group puts on safety events, provides educational scholarships to young equestrians, hosts social events and serves as a liaison for equine advocacy with local government agencies.
The council also sponsors the Horse Faire at the Kelseyville Pear Festival every year.
For more information, including details about becoming a vendor, please contact Lake County Horse Council President, Debbie James at 338-1014 or visit the group’s website at www.lakecountyhorsecouncil.com .
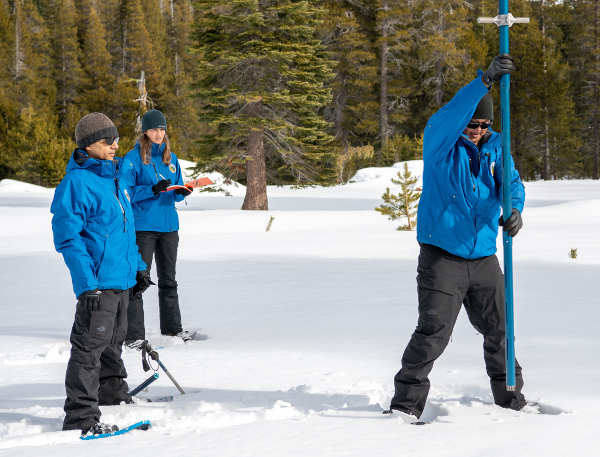
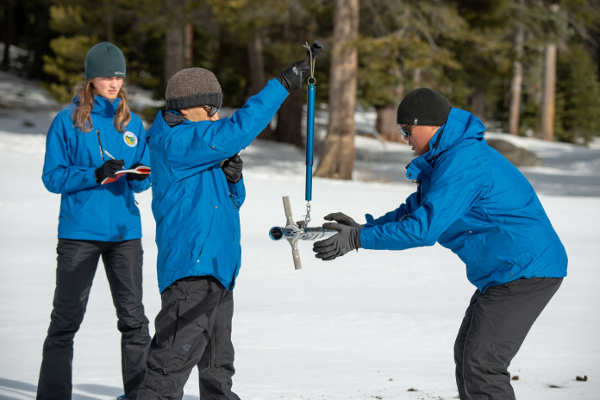
NORTHERN CALIFORNIA – The Department of Water Resources on Thursday conducted the first manual snow survey of 2020 at Phillips Station.
The manual survey recorded 33.5 inches of snow depth and a snow water equivalent, or SWE, of 11 inches, which is 97 percent of average for this location.
The SWE measures the amount of water contained in the snowpack, which provides a more accurate forecast of spring runoff.
“While the series of cold weather storms in November and December has provided a good start to the 2020 snowpack, precipitation in Northern California is still below average for this time of year,” said DWR Director Karla Nemeth. “We must remember how variable California’s climate is and what a profound impact climate change has on our snowpack.”
More telling than a survey at a single location are DWR’s electronic readings from 130 stations scattered throughout the State. Measurements indicate that statewide, the snowpack’s SWE is 9.3 inches, or 90 percent of the Jan. 2 average.
“It’s still too early to predict what the remainder of the year will bring in terms of snowpack,” said Sean DeGuzman, chief of DWR’s Snow Surveys and Water Supply Forecasting Section. “Climate change is altering the balance of rain and snow in California. That is why it is important to maintain our measurements of the snowpack to document the change in addition to having critical information to forecast spring runoff.”
California traditionally receives about 75 percent of its annual precipitation during December, January and February, with the bulk of this precipitation coming from atmospheric rivers.
Similar to last year, California experienced a dry start to this water year followed by cold, wet December storms that brought the state up to 74 percent of average annual precipitation for this time of year.
State officials said climate change is expected to lead to continued warming and fewer but more intense storms impacting the snowpack of the Sierra Nevada. These changes continue to impact the distribution of snow across elevations, its pattern of accumulation, and rate of melt.
DWR conducts five media-oriented snow surveys at Phillips Station each winter in January, February, March, April and, if necessary, May.
On average, the snowpack supplies about 30 percent of California’s water needs as it melts in the spring and early summer.
In related news, a snowpack measurement conducted Dec. 30 at Anthony Peak in the Mendocino National Forest’s Covelo Ranger District found snow at a depth of 17 inches with a density of 24 percent, compared to 25.5 inches and 43 percent density measured in January 2019.

The California Racial and Identity Profiling Advisory Board on Thursday announced the release of the third annual report required under the Racial and Identity Profiling Act of 2015, or RIPA.
The report contains an analysis of the approximately 1.8 million stops conducted by California’s eight largest law enforcement agencies during the second half of 2018.
The report also examines civilian complaint data and provides recommendations law enforcement can utilize to enhance their policies, procedures, and trainings on topics that intersect with bias and racial and identity profiling.
In addition to the board’s new report, the California Department of Justice is announcing the launch of a new online dashboard to give researchers, legislators, journalists and all members of the public greater access to RIPA data.
“For the first time ever, Californians have comprehensive racial and identity data on each stop and search conducted by police officers at the largest law enforcement agencies in the state,” said Co-Chair of the Board and Associate Director of Litigation and Policy at Neighborhood Legal Services of Los Angeles Sahar Durali. “This is a critical first step in the fight to end racial profiling. The findings of this data as laid out in the 2020 Board report highlight the need for the policy recommendations of the board. We encourage law enforcement agencies to work with their communities and utilize the RIPA data to make meaningful changes to their policies, practices, and operations. The board looks forward to partnering with agencies, community members, and advocacy groups in those efforts.”
“As co-chair to the board, I would like to thank California Department of Justice staff and my fellow board members for their professionalism throughout the past year,” said Co-Chair of the Board and Kings County Sheriff Dave Robinson. “Many continually express support and appreciation for the difficult job the men and women of California law enforcement do every day. The report is just the beginning of information that will allow even greater transparency for law enforcement and our communities – allowing us to grow together working on local and statewide areas of concern. And finally, to the men and women who have embraced the challenges of the data collection and reporting: we thank you. Your commitment is appreciated.”
“Good data is a critical component of making good policies,” said California Attorney General Xavier Becerra. “The California Department of Justice’s new online dashboard will help make important criminal justice information more accessible to everyone in California. Here at the California Department of Justice, we’re committed to doing our part to increase transparency and accountability to help strengthen trust between law enforcement and communities across our state.”
The information collected under RIPA includes data on peace officers’ perceptions of the demographics of stopped individuals.
The purpose of collecting information on officer perceptions is to attempt to systematically document and analyze stops and searches to determine whether disparities can be found across demographics.
The perceived demographic information collected includes a number of characteristics such as race or ethnicity, gender, age, disability status, English fluency, and LGBT identity.
There are a number of methodologies to analyze stop data that can help determine if bias may exist, and the report relies on several well-established methods as reference points.
However, there are important limitations and caveats for each methodology that should be kept in mind when interpreting the data.
The report goes into further detail on many of those considerations. Some of the key findings from the first round of RIPA data include:
Reason for Stop: Across all racial and ethnic groups, the most common reason peace officers reported for initiating a stop was a traffic violation (84.4%) and the next most common reason was reasonable suspicion of criminal activity (11.4%). People who were perceived as Black had the highest proportion of stops for reasonable suspicion while those who were perceived as Middle Eastern or South Asian had the lowest.
– Perceived as Black: 19.5 percent
– Perceived as Middle Eastern or South Asian: 3.6 percent
Weighted residential population compared to stop data: Using data from the 2017 American Community Survey, people who were perceived as Black were overrepresented in the stop data and people perceived as Asian were underrepresented as compared to population estimates.
– Perceived as Black: +8.8 percent
– Perceived as Asian: -6.4 percent
Veil of darkness analysis: This method compares the proportion of individuals stopped during daylight hours across racial or ethnic groups. Having a higher proportion of stops occur in daylight compared to people perceived as White may indicate bias. People perceived as Pacific Islander or Native American had the highest proportion of their stops in daylight compared to those perceived as White, whereas people perceived as Black or Middle Eastern or South Asian had the lowest.
– Perceived as Pacific Islander: +7 percent
– Perceived as Native American: +4.5 percent
– Perceived as Middle Eastern or South Asian: -0.05 percent
– Perceived as Black: -1.2 percent
Search rates: Search rates refer to the proportion of stops that resulted in a search. People who were perceived as Black were searched at 2.9 times the rate of people perceived as White. The proportion of stops that resulted in a search was highest for people who were perceived as Black and lowest for people who were perceived as Middle Eastern or South Asian.
– Perceived as Black: 18.7 percent
– Perceived as Middle Eastern or South Asian: 2.8 percent
Search yield rates: Search yield rate refers to the proportion of individuals that officers searched who were found to be in possession of contraband or evidence. All racial or ethnic groups of color had lower yield rates of contraband or evidence than White individuals, meaning that officer searches of these groups tended to be less successful at finding contraband or evidence.
The proportion of searched individuals that officers found to be in possession of contraband or evidence was highest for people who were perceived as White and lowest for people who were perceived as Middle Eastern or South Asian.
– Perceived as White: 24.3 percent
– Perceived as Middle Eastern or South Asian: 18.8 percent
New dashboard offered
For more on the first round of RIPA data, members of the public are encouraged to review the new online dashboard.
The dashboard provides a unique look at the data and gives the public unprecedented access to information on stops and searches conducted by California’s eight largest law enforcement agencies collected from July 1, 2018 through Dec. 31, 2018.
RIPA requires California law enforcement agencies to collect and maintain demographic data on all stops and searches.
As part of the 2015 law, the board was formed in July 2016 to analyze the data, develop policy, and make recommendations through yearly public reports.
By April 2023, all agencies that employ peace officers in California will be required to submit RIPA data to the California Department of Justice.
The California Legislature charged the board with an ambitious purpose – to eliminate racial and identity profiling and improve diversity and racial and identity sensitivity in law enforcement.
The board unites a diverse group of individuals from across different sectors – law enforcement, civil and human rights organizations, community groups, and academia – to work toward improving law enforcement-community relations in California through collaboration, transparency, and accountability.
The eight law enforcement agencies included in the first round of data collection are the California Highway Patrol, Los Angeles Police Department, Los Angeles County Sheriff’s Department, Riverside County Sheriff’s Department, San Bernardino County Sheriff’s Department, San Diego Police Department, San Diego County Sheriff’s Department and the San Francisco Police Department.
A copy of the report is available here. A fact sheet on the 2020 RIPA report is available here. A copy of the supplemental technical report is available here. More information about the board is available here.
LAKE COUNTY, Calif. – The most recent crop report for Lake County shows an overall drop in value, particularly for the top commodities, but increases in some of the smaller crops and products.
Agricultural Commissioner Steve Hajik presented the “crop report plus” for 2018 to the Board of Supervisors in December.
As in past years, the report did not include or attempt to quantify the value of cannabis growing in Lake County. Cannabis was legalized in California for medical use in 1996 and for recreational use in 2016.
Hajik previously reported to the supervisors that while cannabis is expected to eventually be included in crop reports, not including it in the reports now is due to it not being recognized as a crop by state and federal officials.
He said that he commissioned a report for 2018 that determined the economic contributions of agriculture in the county based on the 2017 crop report.
Dr. Jeff Lanholz and Dr. Fernando DePaolis of Agricultural Impacts Associates, a consulting firm specializing in agricultural economics, conducted the study on which the latest crop report is based.
Hajik said the report quantifies agriculture’s total economic contributions through food production, local food processing, and employment and economics multiplier effects.
The report said the gross value of agricultural production in Lake County for 2018 was $111,470,311, an 8-percent decrease from 2017 when the total estimated value was $120.8 million.
The report doesn’t represent gross agricultural receipts nor the production costs or net income to producers, Hajik said.
The gross values included in the report represent the value of each commodity at the time of harvest, with the exception of pears. The gross value of pears given is for after they are packed and processed.
Hajik said the crop report plus shows that agriculture has a broader role in sustaining a thriving local economy.
He said that, according to the study, Lake County agriculture contributed $339.2 million to the local economy in 2017 and supported 2,202 jobs.
“To put this in perspective, Lake County agriculture contributes $929,212 per day or $38,717 per hour,” Hajik said in his report to the supervisors.
Hajik said the report found that $241 million came from direct economic output and $98.2 million in additional economic output, specifically, “multipliers” include business-to-business supplier purchases – such as purchasing farm equipment and seed – and consumption spending, such as for groceries and housing, by owners and their employees of agricultural businesses.
There also were 2,061 jobs associated with direct economic output and 141 additional jobs attributed to multiplier effects.
“One in 12 jobs in Lake County are directly attributed to the various agricultural industries. That is 8.5 percent of the county workforce,” Hajik reported to the board.
Hajik said the 8-percent decrease in production value from 2017 to 2018 is attributed to decreases in the value of the winegrape, pear and walnut industries, Lake County’s three main agricultural commodities.
Winegrapes, Lake County’s No. 1 commodity, had a gross value of $81,469,587 in 2018, a decrease of 4 percent from 2017. Total tonnage was 46,426, with total grape acreage at 9,680 acres, an increase of 172 acres. The report said that the tons per acre decreased by 9 percent and the average price decreased by 2 percent.
For pears, the No. 2 commodity, the gross value for 2018 was $21,174,763. Pears shows the largest single decrease of any agricultural product, 21 percent, compared to 2017, according to the report.
The report said total pear production decreased by 8,480 tons and the price per ton also decreased by 2 percent.
While pear acreage remained the same at 2,034 acres, some orchards were removed following the 2018 harvest, the report explained.
For the No. 3 commodity, walnuts, the gross value was $3,450,150, down 6 percent.
The report said that walnut production actually increased in 2018 by 3 percent, but the price per ton decreased by 10 percent and acreage was down by 200 acres.
For the smaller commodities, the report showed a number of increases, including nursery production, 9 percent; livestock production, 15 percent; vegetable production, 19 percent; and miscellaneous fruits and nuts, 2 percent.
The largest single commodity increase was in timber, which saw a 61-percent rise, based on the report.
Among the smaller commodities, there were decreases, including a 6 percent drop for livestock and poultry products and 4 percent reduction for field and seed crops.
Email Elizabeth Larson atThis email address is being protected from spambots. You need JavaScript enabled to view it. . Follow her on Twitter, @ERLarson, or Lake County News, @LakeCoNews.
Agricultural Commissioner Steve Hajik presented the “crop report plus” for 2018 to the Board of Supervisors in December.
As in past years, the report did not include or attempt to quantify the value of cannabis growing in Lake County. Cannabis was legalized in California for medical use in 1996 and for recreational use in 2016.
Hajik previously reported to the supervisors that while cannabis is expected to eventually be included in crop reports, not including it in the reports now is due to it not being recognized as a crop by state and federal officials.
He said that he commissioned a report for 2018 that determined the economic contributions of agriculture in the county based on the 2017 crop report.
Dr. Jeff Lanholz and Dr. Fernando DePaolis of Agricultural Impacts Associates, a consulting firm specializing in agricultural economics, conducted the study on which the latest crop report is based.
Hajik said the report quantifies agriculture’s total economic contributions through food production, local food processing, and employment and economics multiplier effects.
The report said the gross value of agricultural production in Lake County for 2018 was $111,470,311, an 8-percent decrease from 2017 when the total estimated value was $120.8 million.
The report doesn’t represent gross agricultural receipts nor the production costs or net income to producers, Hajik said.
The gross values included in the report represent the value of each commodity at the time of harvest, with the exception of pears. The gross value of pears given is for after they are packed and processed.
Hajik said the crop report plus shows that agriculture has a broader role in sustaining a thriving local economy.
He said that, according to the study, Lake County agriculture contributed $339.2 million to the local economy in 2017 and supported 2,202 jobs.
“To put this in perspective, Lake County agriculture contributes $929,212 per day or $38,717 per hour,” Hajik said in his report to the supervisors.
Hajik said the report found that $241 million came from direct economic output and $98.2 million in additional economic output, specifically, “multipliers” include business-to-business supplier purchases – such as purchasing farm equipment and seed – and consumption spending, such as for groceries and housing, by owners and their employees of agricultural businesses.
There also were 2,061 jobs associated with direct economic output and 141 additional jobs attributed to multiplier effects.
“One in 12 jobs in Lake County are directly attributed to the various agricultural industries. That is 8.5 percent of the county workforce,” Hajik reported to the board.
Hajik said the 8-percent decrease in production value from 2017 to 2018 is attributed to decreases in the value of the winegrape, pear and walnut industries, Lake County’s three main agricultural commodities.
Winegrapes, Lake County’s No. 1 commodity, had a gross value of $81,469,587 in 2018, a decrease of 4 percent from 2017. Total tonnage was 46,426, with total grape acreage at 9,680 acres, an increase of 172 acres. The report said that the tons per acre decreased by 9 percent and the average price decreased by 2 percent.
For pears, the No. 2 commodity, the gross value for 2018 was $21,174,763. Pears shows the largest single decrease of any agricultural product, 21 percent, compared to 2017, according to the report.
The report said total pear production decreased by 8,480 tons and the price per ton also decreased by 2 percent.
While pear acreage remained the same at 2,034 acres, some orchards were removed following the 2018 harvest, the report explained.
For the No. 3 commodity, walnuts, the gross value was $3,450,150, down 6 percent.
The report said that walnut production actually increased in 2018 by 3 percent, but the price per ton decreased by 10 percent and acreage was down by 200 acres.
For the smaller commodities, the report showed a number of increases, including nursery production, 9 percent; livestock production, 15 percent; vegetable production, 19 percent; and miscellaneous fruits and nuts, 2 percent.
The largest single commodity increase was in timber, which saw a 61-percent rise, based on the report.
Among the smaller commodities, there were decreases, including a 6 percent drop for livestock and poultry products and 4 percent reduction for field and seed crops.
Email Elizabeth Larson at
2018 Crop Report for Lake County, California by LakeCoNews on Scribd