 How to resolve AdBlock issue?
News
- Details
- Written by: LAKE COUNTY NEWS REPORTS

LAKE COUNTY, Calif. — Lake County now officially has a new chief probation officer.
Wendy Mondfrans has been appointed chief probation officer by the judges of the Lake County Superior Court.
Mondfrans has been filling the position on an interim basis since Jan. 3, after her predecessor, Rob Howe, was sworn in as the new sheriff, the court reported.
Court officials said Mondfrans has worked for Probation since 2010, and has held several positions including deputy probation officer, senior, chief deputy probation officer, and most recently assistant chief probation officer.
As assistant chief probation officer, Mondfrans has experience in managing all divisions and functions within the Probation Department.
Prior to her work with Probation, Mondfrans was a practicing attorney.
“Wendy’s knowledge of the probation field, her commitment to the Probation Department and her work ethic are all second to none. She has been my ‘go to’ person for all things probation. The department is in good hands,” said Sheriff Howe.
"I would like to thank the Judges for this opportunity and their faith in me to continue leading the Probation Department,” Mondfrans said. “The dedicated and hardworking individuals who work in the Department are committed to public safety, helping victims, and utilizing evidence based practices to assist offenders to achieve a more productive lifestyle. It is an honor and a pleasure to work with the employees and partnering agencies each day.”
- Details
- Written by: LAKE COUNTY NEWS REPORTS
The agency said it is seeking information on the whereabouts of Kayla Johnston, 28.
Johnston was last seen in the area of West 40th and Carrol avenues.
She is described as a white female adult, 5 feet 2 inches tall and 110 pounds, with brown shoulder length hair and hazel eyes.
She was last seen wearing a hot pink hoodie and dark blue jeans.
If you have any information regarding her whereabouts please contact the Clearlake Police Department at 707-994-8251, Extension 1 for dispatch.
- Details
- Written by: Elizabeth Larson
The Employment Development Department reported that Lake County’s unemployment rate was 5.1% in December, down from the 5.3% rate reported in November.
In December 2021, Lake County’s jobless rate was 5.8%.
The state of California’s unemployment rate in December was 4.1%, the same as November 2022’s rate. The state jobless rate in December 2021 was 5.8%.
The Bureau of Labor Statistics said the national unemployment rate in December 2022 was 3.5%, compared to 3.6% in November and 3.9% in December 2021.
In Lake County in December, the workforce totaled 28,130 individuals, with 1,430 unemployed.
Most industry sectors in Lake County showed drops in job numbers or no change, with the exception of professional and business services, which showed an increase of 2.8%, and retail trade, up by 0.4%.
California payroll jobs totaled 17,761,900 in December 2022, up 16,200 from November 2022 and up 621,400 from September of last year.
The number of Californians employed in December was 18,440,500, a decrease of 20,000 persons from November’s total of 18,460,500, but up 589,500 from the employment total in December, according to the report.
The Employment Development Department said the number of unemployed Californians was 782,300 in December, a decrease of 6,700 over the month and down 312,800 in comparison to December 2021.
Total nonfarm jobs in California’s 11 major industries totaled 17,761,900 in December — a net gain of 16,200 from November. This followed a downward revised (-6,900) month-over gain of 19,900 jobs in November, the state said.
The report said total nonfarm jobs increased by 621,400 (a 3.6% increase) from December 2021 to December 2022 compared to the U.S. annual gain of 4,503,000 jobs (a 3% increase).
The number of jobs in the agriculture industry increased from November by 5,100 to a total of 416,200 jobs in December. The agricultural industry had 4,900 more farm jobs in December 2022 than it did in December a year ago, the state said.
The Employment Development Department said December 2022 marked the 15th consecutive month of nonfarm job gains, which now totals 807,300 jobs over that time period for a monthly average gain of 53,820 jobs.
Year over, California job growth at 3.6% has outpaced the U.S. as a whole at 3% by 0.6 percentage points and the state has 70,000 more jobs than pre-pandemic levels in February 2020.
In other news, nine of California’s 11 industry sectors gained jobs in December with education and health services (+8,200) showing the largest month-over gains thanks to strength in home health care services, residential care facilities, and individual and family services, the Employment Development Department reported.
Construction (+7,500) also enjoyed a strong month-over gain of more than 7,500 jobs thanks, in part, to good gains in specialty trade contractors, the report showed.
The state said trade, transportation and utilities (-11,100) suffered from losses in merchant wholesalers of both durable and nondurable goods, as well as with reductions in retail trade, including health and personal care stores and office supplies, stationary, and gift stores.
Lake County’s unemployment rate last month earned it the No. 41 ranking statewide among the state’s 58 counties.
San Mateo continued to have California’s lowest unemployment rate, 1.9%, while Imperial had the highest, 14.8%.
Lake’s neighboring county jobless rates and ranks were: Colusa, 12.2%, No. 57; Glenn, 5.2%, No. 42; Mendocino, 3.8%, No. 26; Napa, 3%, No. 14; Sonoma, 2.5%, No. 6; and Yolo, 3.6%, No. 22.
In related data that figures into the state’s unemployment rate, there were 326,252 people certifying for Unemployment Insurance benefits during the December 2022 sample week. That compares to 306,550 people in November and 355,749 people in December 2021.
Concurrently, 41,550 initial claims were processed in the December 2022 sample week, which was a month-over decrease of 6,271 claims from November and a year-over decrease of 7,521 claims from December 2021.
Email Elizabeth Larson at
- Details
- Written by: Sam Polzin, Purdue University and Jayson Lusk, Purdue University
Grocery prices soared by 11.8% in 2022 – the swiftest pace since the early 1980s. Rapid inflation is, naturally, leading to concerns that it’s getting harder for Americans to put food on the table.
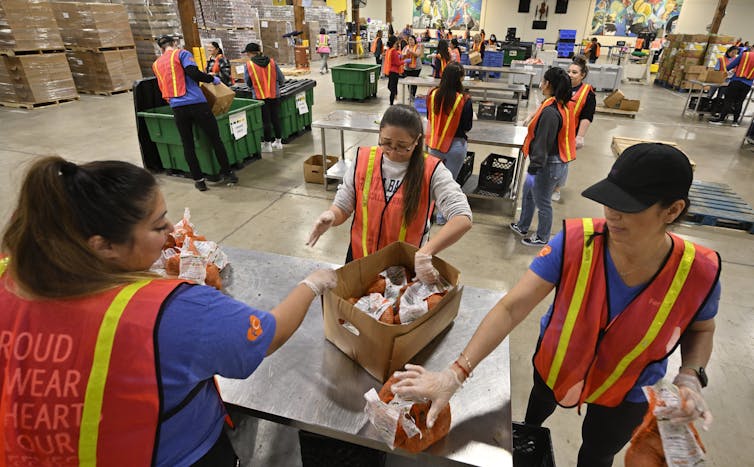
Indeed, Feeding America, a nonprofit that supports and connects roughly 60,000 food banks and pantries nationwide, has said that at least half of its members are seeing more demand for their services. And many journalists are reporting about struggling parents waiting in long lines for free food.
We are experts on food and agricultural economics. Together we have created a new data dashboard that tracks U.S. food insecurity – the technical term for having trouble getting enough nutritious food – based on publicly available information.
The data we’re collecting ourselves, as well as the information that we’ve compiled from other sources, including the Census Bureau, isn’t yet reflecting a sharp uptick in households without enough to eat. U.S. food insecurity has remained at troubling and yet relatively flat levels.
Based on all the data we’ve included in our dashboard, we estimate that over the course of 2022 somewhere between 11% and 15% of those living in the U.S. struggled with securing their next meal.
This range relies, in part, on internet-based surveys that can often produce food insecurity estimates that are higher than official government data. Because it is expensive to reach a true random sample of Americans, cheaper online surveys are commonly unrepresentative of the U.S. population but still prove to be a key tool for measuring changes compared with previous online surveys.
Official estimates are delayed and possibly low
Food insecurity is officially assessed based on a series of survey questions developed by the U.S. Department of Agriculture Economic Research Service. Every December, the federal government uses this measure to assess food insecurity for the past year. Following extensive analysis, it releases that data in September of the next year.
The official food insecurity rate hovered around 10.5% from 2019 to 2021, according to the USDA.
During those same three years, however, other researchers detected both lower and much higher rates. Our average of these surveys suggests that national levels may have peaked at nearly 19% in the months following the onset of the COVID-19 pandemic the U.S. in March 2020.
Within about six months, food insecurity returned to the 10%-11% range, based on our average of available data.
A mismatch between the facts and the coverage
Why are reports of long lines at food banks and increased demand for free food apparently at odds with the relative stability in the national food insecurity rate?
One reason could be that food insecurity rates, which generally overlap with social and economic inequality, can differ sharply.
For example, Nassau County, which spans many of New York City’s largely affluent Long Island suburbs, had a food insecurity rate of 5.7% in 2020. In nearby Bronx County, New York state’s lowest-income county, the food insecurity rate was more than three times that, at 19.7%, according to Feeding America’s Map the Meal Gap study.
As a result, food security can get worse or better in particular communities without affecting the national rate.
Another explanation could be that government programs and nonprofits that help people get enough food are succeeding. The number of people getting Supplemental Nutrition Assistance Program benefits, sometimes referred to as “food stamps” and generally just called SNAP, increased by 2.8% from January to October 2022, to 42.3 million.
In some states, SNAP benefits remain at the elevated levels instituted when the COVID-19 pandemic began.
Survey data from our Consumer Food Insights reports also shows that the average length of time households receive SNAP benefits increased from 9.5 months to 12.4 months in 2022.
Nearly 7% of households were visiting food pantries in December 2022, according to the Census Bureau, up from 4.4% in 2019. At the same time, the USDA announced an additional US$2 billion in funding to emergency food providers to deal with elevated food costs.
The charitable food system is decentralized, making it hard if not impossible to determine whether the amount of food donated to Americans overall has changed. As Feeding America reports, the 2.5 billion meals that its network provided in the first half of 2022 came from a range of donors, with its corporate partners playing a big role.
The data further suggests that, while consumer confidence about the overall economy is at a historically low level, fears of an economic downturn don’t reflect the fact that many people still have more money saved up than they did before 2020. Similarly, unemployment, which dipped to 3.5% in December 2022, is at the historically low levels last seen before the COVID-19 pandemic.
Finally, researchers have found that incomes over time and accumulated savings are more closely tied to whether families will experience food insecurity than what their breadwinners currently earn. Because the disposable incomes of many Americans rose in 2020 and 2021, it will probably take a deeper economic shock than the nearly 12% increase in grocery prices registered between December 2021 and December 2022 to make food insecurity soar.
Getting clearer pictures
To be clear, we do not mean to suggest that food insecurity is not a serious issue or that having more than 1 in 10 Americans struggle to get enough to eat is acceptable.
Rather, we noticed that policy and research interest in food insecurity spiked in the year following COVID-19 shutdowns, resulting in much more data on the topic before dwindling in 2021. Today, the public is paying more attention to the topic again.
Food banks and SNAP benefits collectively have provided around $130 billion in annual economic relief for low-income Americans in recent years, a number that includes a sharp increase in benefits. We believe that these efforts are vital.
We propose that conducting and releasing more frequent high-quality surveys would help bring sustained attention to the issue, clarify trends and allow experts like us to make better predictions.
And because all food insecurity surveys are subject to sampling errors and offer only a snapshot regarding a single time frame, we believe that pooling the multiple surveys featured in our data dashboard can better inform policymakers and charities that seek to address food insecurity and rapidly respond when levels spike.![]()
Sam Polzin, Food and Agriculture Survey Scientist, Purdue University and Jayson Lusk, Professor of Agricultural Economics, Purdue University
This article is republished from The Conversation under a Creative Commons license. Read the original article.