 How to resolve AdBlock issue?
News
- Details
- Written by: Elizabeth Larson
Treasurer-Tax Collector Patrick Sullivan urged the board not to accept the offer from North State Solutions, based in Chico, for numerous reasons, ranging from the below-market-value offer to the challenge of monitoring the project.
“My office has a number of concerns about this application,” he said Tuesday evening.
Brenda Pickern of Chico submitted filings to the Secretary of State’s Office on Sept. 4 to form North State Solutions, the specific purpose of which “is to acquire single-family dwellings for rehabilitation and sale to low-income persons, vacant land for construction of low-income housing, or vacant land to be dedicated to public use.”
Pickern is a disability rights advocate who also has filed numerous lawsuits against businesses — including Safeway and Pier 1 Imports — due to accessibility issues.
While North State Solutions has filed with the Secretary of State, it so far is not shown as having been registered in the California Attorney General’s Office online database of charitable organizations.
Eight days after filing with the Secretary of State’s Office, Pickern’s organization transmitted an offer to the Treasurer-Tax Collector’s Office to purchase all remaining tax-defaulted properties that did not sell at the June 2022 sale, Sullivan said.
Altogether, North State Solutions offered to purchase the 548 remaining properties for $354,934.60 in cash, which Sullivan said actually represented 5% of the land value and is “a significant potential discount from the assessed value.”
He said the offer came in the form of an “Application to Purchase Tax Defaulted Property” using a template designated by the State Controller’s Office.
Sullivan’s written report said sales of this type are permissible pursuant to Chapter 8 of the Revenue and Taxation Code.
“Eligible entities include government agencies and nonprofit organizations, for purposes including the utilization of vacant land for public use, including preservation of open space; rehabilitation or construction of residential dwellings for either sale or rent to low-income persons; or for other use to serve low-income persons,” his written report explained.
Sullivan said North State Solutions “may preliminarily meet the criteria for eligibility,” however, he couldn’t recommend approving the proposed agreement.
While his office encourages Chapter 8 sales to agencies and nonprofit organizations, “these proposals should generally be more targeted to specific properties with a carefully proposed project,” Sullivan wrote.
“In this case, North State, a newly created entity without a record of experience in this field, has submitted a proposal that is beyond the typical scope of such an offer, which can impose a substantial burden on County staff. The properties included in this proposal are from a variety of locations throughout the County with varying types of zoning, making the monitoring of this agreement challenging,” he said in his written report.
He told the board on Tuesday, “There’s not really any rhyme or reason geographically,” with the properties in question including some paper lots.
Sullivan said the scope of the application and the purchase offer “is just too vast for us to take on,” and it would place a significant burden on his office and also would require assistance from other county departments.
For that reason, he suggested denial. Until the offer was addressed, Sullivan said he couldn’t offer the properties to other agencies or put them back up for future tax sale.
The board took Sullivan’s suggestion and unanimously voted to deny the proposal.
Lake County News reviewed about 30 lots in the Lucerne area that were included in the proposed sale agreement. While about seven or eight appeared to be buildable, the rest were not, and either were located on creeks along roadsides or in the paper subdivisions above town.
The county’s 2015 paper lot subdivision management plan had stated that the county had been pulling paper lots from tax sales in order to prevent them from recirculating and being sold and resold as they have been for nearly a century.
Lake County News followed up with Sullivan on the issue of paper lots getting back onto the tax sale list.
Sullivan, who took office at the start of January, said in an email that based on what he’s learned over the past month, “the best available list of paper subdivision parcels is not comprehensive, so there were still paper parcels that slip into the auctions.There are also parcels that share those characteristics that do not actually fall into those one of the identified subdivisions.”
Sullivan added, “The County has now committed to attempting to sell 1,000 tax defaulted properties per year to clear the existing tax defaulted inventory, so that prior directive not to list them is now removed.”
He said he has plans moving forward to address the problem of the paper subdivision lots, which he said will need to be developed over the next several months.
Sullivan’s plans include creating a low value ordinance to take to the Board of Supervisors, building a list of parcels for which the debt could be discharged, doing outreach to agencies and nonprofits that would be interested in purchasing such properties — an action already being discussed with the city of Clearlake — and also pursuing bids from adjacent landowners.
Based on recent data, Sullivan concluded that there are less than 1,300 tax defaulted properties eligible for sale with an assessed value over $5,000. Many of those properties will be included on a list being developed for the May tax default sale.
As such, Sullivan said he has to develop his actions to address the paper lots quickly. Otherwise, starting in the fall, when the next auction list goes into development, “the County’s remaining inventory would begin to exist solely of the low value parcels other than newly eligible defaulted properties.”
He added, “Given the default rate, we would find ourselves perpetually listing these parcel types in annual auctions, in a sporadic manner and at great expense.”
Sullivan wants to provide the county with an opportunity to develop a plan to address the paper subdivisions “without thousands of them appearing in tax sales where individual buyers may be purchasing without the intent or capacity to address the existing issues.”
Email Elizabeth Larson at
- Details
- Written by: Elizabeth Larson

CLEARLAKE, Calif. — Clearlake Animal Control has more new dogs waiting to be adopted this week.
Among those still waiting for homes is Terry, a 3-year-old shepherd mix with a short brown coat.
Staff said he has been neutered and so is ready to go to a new home.
The shelter reported that Snowball, who was at the shelter for several months, has been adopted and is enjoying life in his new home.
There currently are 41 adoptable dogs at the shelter, with staff hoping to find them loving homes.
The shelter is located at 6820 Old Highway 53. It’s open from 9 a.m. to 6 p.m. Tuesday through Saturday.
For more information, call the shelter at 707-762-6227, email
This week’s adoptable dogs are featured below.
Email Elizabeth Larson at
- Details
- Written by: CALIFORNIA DEPARTMENT OF WATER RESOURCES
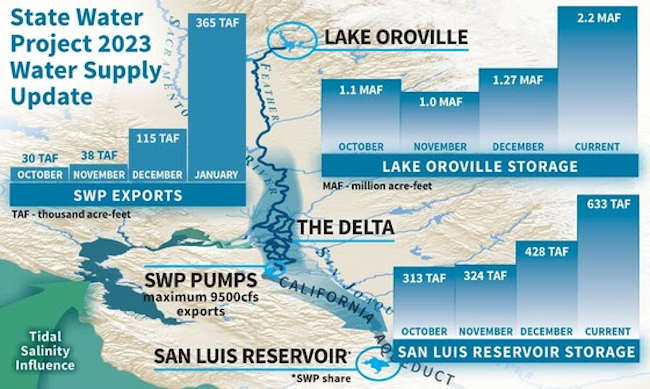
The Department of Water Resources on Thursday announced that recent storms will allow the State Water Project to boost deliveries to 29 public water agencies serving 27 million Californians.
Based on the amount of water captured and stored in recent weeks, DWR now expects to deliver 30 percent of requested water supplies — or 1.27 million acre-feet — in 2023, up from the initial 5 percent announced on Dec. 1.
The allocation increase is the direct result of extreme weather in late December and nine atmospheric rivers in early January that helped fill reservoirs and dramatically increase the Sierra Nevada snowpack.
The SWP’s two largest reservoirs (Oroville and San Luis) have gained a combined 1.62 million acre-feet of water in storage — roughly enough to provide water to 5.6 million households for a year.
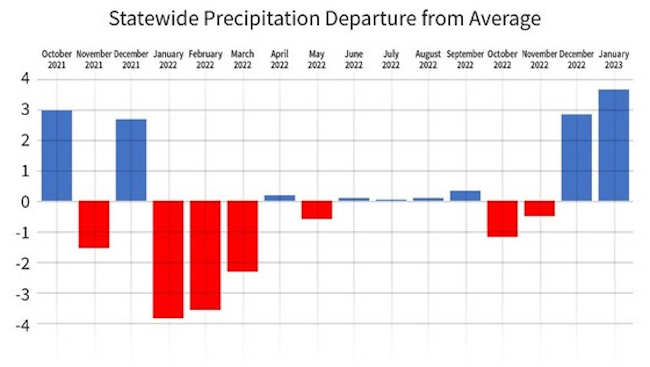
While Water Year 2023 began with below average precipitation, conditions shifted to extreme above average conditions.
Statewide Precipitation from Departure to Average Graph From October 2021 to January 2023 “We are pleased that we can increase the allocation now and provide more water to local water agencies,” said DWR Director Karla Nemeth. “These storms made clear the importance of our efforts to modernize our existing water infrastructure for an era of intensified drought and flood. Given these dramatic swings, these storm flows are badly needed to refill groundwater basins and support recycled water plants.”
The updated SWP delivery forecast takes into account current reservoir storage and is based on a conservative runoff forecast. It does not take into account the current Sierra Nevada snowpack.
DWR will conduct snow surveys on Feb. 1, March 1, April 1, and May 1 and may further update the allocation as the water supply outlook becomes clearer with the new data.
In addition to on the ground surveys, DWR will gather data from its Airborne Snow Observatory, or ASO, surveys.
For the second year in a row, DWR is broadening the deployment of these more sophisticated technologies, such as ASO surveys, that can collect snow measurements farther upslope of the Sierra Nevada.
The data from these flights, which use LIDAR and spectrometer technology to measure snowpack across broad swathes of key watersheds, will be used by DWR to get a more accurate account of California’s snowpack and to update water supply runoff forecasts.
Since the storms California experienced this month saw variable snow elevations, the data from ASO flights will help DWR verify snow course and snow sensor data and understand how snow has been distributed across the Sierra Nevada.
DWR cautioned that while recent storms have been impressive, two months remain in the wet season and California could see a return to warm and dry conditions prior to April 1.
Californians should continue to use water wisely to help the state adapt to a hotter, drier future and the possible return of drought.
The SWP pumps currently are operating at maximum capacity of 9,500 cubic feet per second, or CFS, and will continue to be adjusted as needed to meet State and federal requirements.
However, had the proposed Delta Conveyance Project been in place, the SWP could have stored an additional 202,000 acre-feet of water — enough to supply more than 710,000 households for a year — between Jan. 1 and Jan. 23 while staying within compliance of rules to protect endangered species.
California traditionally receives half its rain and snow by the end of January. Water managers will reassess conditions monthly throughout the winter and spring. Starting in February, the assessments will incorporate snowpack data and runoff forecasts.
Water managers will be monitoring how the wet season develops and whether further actions may be necessary later in the winter. Additional actions that have been taken previously, such as submission of a Temporary Urgency Change Petition or installation of the West False River Emergency Drought Salinity Barrier in the Sacramento-San Joaquin Delta, are unlikely this year based on current conditions.
Each year, DWR provides the initial SWP allocation by Dec. 1 based on available water storage, projected water supply, and water demands.
Allocations are updated monthly as snowpack and runoff information is assessed, with a final allocation typically determined in May or June.
The lowest initial SWP allocation was zero percent on Dec. 1, 2021, with limited water designated only for any unmet human health and safety needs.
Last year’s final allocation was 5 percent plus unmet human health and safety needs. Four of the 29 State Water Contractors ultimately requested and received additional human health and safety water supply.
- Details
- Written by: Andrew Stokes, Boston University; Dielle Lundberg, Boston University; Elizabeth Wrigley-Field, University of Minnesota, and Yea-Hung Chen, University of California, San Francisco
Since the COVID-19 pandemic was declared in March 2020, a recurring topic of debate has been whether official COVID-19 death statistics in the U.S. accurately capture the fatalities associated with SARS-CoV-2, the virus that causes COVID-19.
Some politicians and a few public health practitioners have argued that COVID-19 deaths are overcounted. For instance, a January 2023 opinion piece in The Washington Post claims that COVID-19 death tallies include not only those who died from COVID-19 but those who died from other causes but happened to have COVID-19.
Most scientists, however, have suggested that COVID-19 death tallies represent underestimates because they fail to capture COVID-19 deaths that were misclassified to other causes of death.
We are part of a team of researchers at Boston University, University of Minnesota, University of California San Francisco and other institutions who have been tracking COVID-19 deaths since the beginning of the pandemic. A major goal for our team has been to assess whether the undercounting of COVID-19 deaths has occurred, and if so in which parts of the country.
Examining excess deaths
One way to examine the issue is to look at what population health researchers call excess mortality. It’s a measure which, in this case, compares the number of deaths that occurred during the pandemic to the number of deaths that would have been expected based on pre-pandemic trends.
Excess mortality captures deaths that arose from COVID-19 directly or through indirect pathways such as patients avoiding hospitals during COVID-19 surges. While determining a cause of death can be a complex process, recording whether or not someone died is more straightforward. For this reason, calculations of excess deaths are viewed as the least biased estimate of the pandemic’s death toll.
As a general rule of thumb – with some important caveats that we explain below – if there are more COVID-19 deaths than excess deaths, COVID-19 deaths were likely overestimated. If there are more excess deaths than COVID-19 deaths, COVID-19 deaths were likely underestimated.
In a newly released study that has not yet been peer-reviewed, our team found that during the first two years of the pandemic – from March 2020 to February 2022 – there were between 996,869 and 1,278,540 excess deaths in the U.S. Among these, 866,187 were recognized as COVID-19 on death certificates. This means that there were between 130,682 and 412,353 more excess deaths than COVID-19 deaths. The gap between excess deaths and COVID-19 deaths was large in both the first and second years of the pandemic. This suggests that COVID-19 deaths were undercounted even after the pandemic’s chaotic early months.
Major studies have also concluded that excess deaths exceeded COVID-19 deaths at the national level during the first two years of the pandemic. And preliminary analyses by our team have found that the gap between excess deaths and COVID-19 deaths has persisted into the third year of the pandemic. This suggests that COVID-19 deaths are still being undercounted.
Making sense of the discrepancy
Explaining the discrepancy between excess deaths and reported COVID-19 deaths is a more challenging task. But several threads of evidence support the idea that the difference largely reflects uncounted COVID-19 deaths.
In a recent study, we found that excess deaths peaked immediately before spikes in reported COVID-19 deaths. This was the case even for excess deaths associated with causes like Alzheimer’s disease that are unlikely to rapidly change due to patients avoiding hospitals or other changes in behavior during the pandemic.
This finding aligns with the observation that COVID-19 deaths may go unrecognized – and be misclassified to other causes of death – at the beginning of COVID-19 surges. At this time, COVID-19 testing may be less frequent in the community, among medical providers and among death investigators. If excess deaths were not caused by COVID-19, they would instead either remain relatively constant during COVID-19 surges or they would peak afterwards when hospitals were overcrowded and deaths may have resulted from health care interruptions.
Excess deaths related to external causes of death such as drug overdose also increased during the pandemic. However, a preliminary study found that the scale of this increase was small relative to the overall increase in excess deaths. So deaths from external factors alone cannot explain the gap between excess and COVID-19 deaths.
This evidence is worth considering in light of the prominent opinion piece in the Washington Post mentioned earlier, which suggests that the U.S.‘s tally of COVID-19 deaths is a substantial overcount. The author argues that in some hospitals, widespread COVID-19 testing has led patients with COVID-19 who died of other causes to still have COVID-19 included as a cause on their death certificate. There is a fundamental misunderstanding, however, in generalizing these hospital deaths to the entire country.
One reason this overgeneralization is flawed is because hospital deaths are distinct from out-of-hospital deaths. In out-of-hospital settings, COVID-19 testing is often lacking and death investigators have less training and less information about the deceased. In fact, our research suggests that COVID-19 deaths are largely undercounted in out-of-hospital settings.
Investigative reporting among coroners in rural areas has also revealed significant variability in out-of-hospital cause of death assignment. Some coroners have even gone on record to state that they do not include COVID-19 on death records if it contradicts their own political beliefs or if families wish for it to be omitted.
The other problem with the overgeneralization is geographic. Our preliminary study demonstrates that excess deaths exceeded COVID-19 deaths in the vast majority of counties across the U.S. In particular, counties in the South, the Rocky Mountain states and rural areas had many more excess deaths than COVID-19 deaths. This suggests that COVID-19 deaths were likely undercounted in these areas.
The idea that COVID-19 deaths are sometimes overreported is, to a very limited extent, supported by our analyses. A select number of large and medium-sized metro areas in New England and the mid-Atlantic states have had more COVID-19 deaths than excess deaths. But most of the country has not followed the patterns of this small group of counties.
While it is possible that some deaths assigned to COVID-19 in New England and the mid-Atlantic states were not actually caused by COVID-19, other explanations are also possible. First, COVID-19 mitigation efforts could have prevented deaths in these areas via pathways unrelated to COVID-19, reducing excess deaths. For example, some people living in wealthy, urban counties had the privilege to work from home and avoid household crowding, which may have reduced their risk of dying from flu. Flu is typically responsible for as many as 50,000 deaths each year.
In fact, the 2020-2021 flu season was minimal, likely because of social distancing. Another possible explanation is that later in the first two years of the pandemic, there may have also been fewer deaths than expected in some areas because some of the least healthy people in the area had already died of COVID-19. These alternative explanations imply that, even in those New England and mid-Atlantic counties where more COVID-19 deaths were recorded than estimated excess deaths, many COVID-19 deaths may still have occurred even as other kinds of deaths decreased.
Why it matters
Ultimately, figuring out how many people have died as a result of the COVID-19 pandemic is a major scientific undertaking that has significant political importance. Knowing how many people died and where these deaths occurred has widespread implications for informing how current pandemic response resources are allocated and for preparing for future public health emergencies.
As a result, in our view, it is critical that the scientific community carefully reviews the rigor of the science behind the counting of COVID-19 deaths. Given the intense politicization of the pandemic, claims of overcounting or undercounting need to be made cautiously.
Finally, research by our team and investigative reporting conducted in partnership with our team has found that the undercounting of COVID-19 deaths is significantly more common in Black, Hispanic and Native American communities as well as low-income areas. Claims that COVID-19 deaths have been overcounted undermine efforts to reconcile the undercounts in these communities and to ensure resources are being allocated to those most affected. For example, if a person does not have COVID-19 assigned as a cause on their death certificate, their family is ineligible for pandemic social programs such as the FEMA funeral assistance program.
To understand where the U.S. public health system has succeeded and fallen short during the pandemic, a full accounting of deaths caused by COVID-19 is needed. More than that, families, friends and loved ones of those who have died so far also deserve to know the true toll that COVID-19 has taken.![]()
Andrew Stokes, Assistant Professor of Global Health, Boston University; Dielle Lundberg, Research Assistant in the Department of Global Health, Boston University; Elizabeth Wrigley-Field, Assistant Professor of Sociology, University of Minnesota, and Yea-Hung Chen, Research Data Specialist in Epidemiology and Biostatistics, University of California, San Francisco
This article is republished from The Conversation under a Creative Commons license. Read the original article.