LAKE COUNTY, Calif. — The Board of Supervisors this week will get the latest on the renovations of the former Lakeport Armory, which is to house the sheriff’s office headquarters.
The board will meet beginning at 9 a.m. Tuesday, Aug. 27, in the board chambers on the first floor of the Lake County Courthouse, 255 N. Forbes St., Lakeport.
The meeting ID is 865 3354 4962, pass code 726865. The meeting also can be accessed via one tap mobile at +16694449171,,86533544962#,,,,*726865#. The meeting can also be accessed via phone at 669 900 6833.
At 10 a.m., the board will consider the update on the remodel of the National Guard Armory to the Lake County Sheriff’s Office administration facility.
Supervisors also will consider plans and specifications for the remodel and authorize the Public Services director to advertise for bids.
The sheriff’s office remains in its longtime offices on Martin Street. The new facility will create a larger campus that includes the Lake County Jail.
The project’s total cost is $20.7 million, according to the report from Public Services Director Lars Ewing.
In other business, at 9:15 a.m., the board will hold a public hearing to consider an ordinance to regulate smoking and commercial tobacco use in the unincorporated areas of Lake County.
At 11:30 a.m., the board will consider a resolution to extend temporary reduction of the cannabis cultivation tax rate, extend temporarily limiting cultivation tax to canopy area through 2025, and rescind the suspension of tax rate increases pursuant to the Consumer Price Index.
The full agenda follows.
CONSENT AGENDA
5.1: Adopt proclamation commending the Lake County Water Resources team for exemplary work orchestrating the 2024 Clear Lake Integrated Science Symposium, or CLISS.
5.2: Approve continuation of local emergency by the Lake County Sheriff/Office of Emergency Services director for the 2024 late January and early February winter storms.
5.3: Approve continuation of proclamation declaring a Clear Lake hitch emergency.
5.4: Approve continuation of proclamation of the existence of a local emergency due to pervasive tree mortality.
5.5: Approve continuation of emergency proclamation declaring a shelter crisis in the county of Lake.
5.6: Adopt resolution approving the annual Fiscal Year 2024-2025 update to the three-year Lake County Mental Health Services Act Program and Expenditure Plan.
5.7: Approve Board of Supervisors minutes for July 23, 2024, July 30, 2024, and Aug. 6, 2024.
TIMED ITEMS
6.2, 9:03 a.m.: Pet of the Week.
6.3, 9:04 a.m.: New and noteworthy at the library.
6.4, 9:05 a.m.: Consideration of lighting the Lake County Superior Courthouse in purple in recognition and honor of International Overdose Awareness Day.
6.5, 9:06 a.m.: Presentation of proclamation commending the Lake County Water Resources team for exemplary work orchestrating the 2024 Clear Lake Integrated Science Symposium, or CLISS.
6.6, 9:15 a.m.: Public hearing, consideration of an ordinance to regulate smoking and commercial tobacco use in the unincorporated areas of Lake County.
6.7, 10 a.m.: a) Consideration of update on the remodel of the National Guard Armory to the Lake County Sheriff Administration Facility; and b) consideration of plans and specifications for the remodel of the National Guard Armory to the Lake County Sheriff Administration Facility, and authorize the Public Services director to advertise for bids.
6.8, 10:30 a.m.: Consideration of the June 30, 2024, report of Lake County pooled investments.
6.9, 11:30 a.m. : Consideration of resolution to extend temporary reduction of the cannabis cultivation tax rate, extend temporarily limiting cultivation tax to canopy area through 2025, and rescind the suspension of tax rate increases pursuant to the Consumer Price Index.
6.10, 1:30 p.m.: Hearing, consideration of a) appeal (AB 23-03) of Planning Commission’s decision to revoke a major use permit (UP19-15) for Legendary Farms, at 2290 Soda Bay Road, Lakeport (APN 008-010-29) for high severity violations and deem Justin Smith and Melissa Smith responsible persons; and b) appeals (AB 23-02 Roberto Estrada; and AB 23-04 Michael Wegner) of the Planning Commission’s decision to deem these persons as responsible persons for the high severity violations at Legendary Farms (UP 19-15).
6.11, 3 p.m.: Sitting as the Lake County Air Quality Management District Board of Directors, notification of office closure and reduction of services.
UNTIMED ITEMS
7.2: Consideration of the agreement between county of Lake and BHC Heritage Oaks Hospital, Inc., for acute inpatient psychiatric hospital services and professional services associated with acute inpatient psychiatric hospitalization in the amount of $300,000 for Fiscal Year 2024-25.
7.3: Consideration of the following appointment to the Mental Health Advisory Board.
7.4: Consideration of memorandum of understanding and funding agreement between county of Lake and Rural Communities Housing Development Corporation, or RCHDC, and authorize the chair to sign.
CLOSED SESSION
8.1: Closed session item, conference with legal counsel: Decision whether to initiate litigation pursuant to Gov. Code Sec. 54956.9(d)(4): One potential case.
Email Elizabeth Larson at This email address is being protected from spambots. You need JavaScript enabled to view it.. Follow her on Twitter, @ERLarson, or Lake County News, @LakeCoNews.
In an effort to understand how much time poverty affects student outcomes, we surveyed more than 41,000 U.S. college students. We found that the more time poverty, the greater the chances of a student earning fewer credits or dropping out. This is especially true for Black and Hispanic students and for women, who have significantly less time for college compared with their peers, largely due to time spent on their jobs and caring for children.
Our research describes how differences in time available for college are often the result of structural inequities in higher education, such as insufficient financial aid for students who have children or who have to work to pay the bills.
Why it matters
Time poverty explains major differences in student outcomes. In one study, students who dropped out of college had on average nine fewer hours per week available for college than those who did not drop out. And students who earned over 12 credits in a term had on average 18 more hours per week available for college than students who earned only six credits or less. Thus, student outcomes are highly correlated with available time for academics.
Often, there are gaps in college credit attainment between students from different racial or ethnic groups or by gender. However, those gaps shrink significantly – or disappear altogether – when we compare students with similar time available for college. This shows just how important time is as a resource for finishing a college degree.
Time poverty also leads to overwork, which can cause burnout. For example, Black women had the least time for college of any group. Compared with the group with the most time – Asian and Pacific Islander men – Black women had on average 24 fewer hours per week to devote to their studies. However, both groups spent the same amount of time on college.
How is this possible?
Black, Hispanic and women students sacrificed an even greater proportion of their free time – time left over after paid work, housework and child care – on college than their peers. The average total time Black women spent on college as well as paid and unpaid work was 75 hours per week, or equivalent to more than two full-time jobs.
Our findings show that this holds true for all students. On average, the more time-poor they are, the more free time they sacrifice for their studies.
This sacrifice comes at a cost: Students must give up time spent on sleep, meals, health care, leisure and exercise to make time for college. This is particularly worrisome because overwork has been linked to negative impacts on mental and physical health.
In prior research, my colleagues and I have also found that students who are parents – particularly mothers – and students who choose to take online courses have less time available for college than their peers. This explains differences in academic outcomes. Time poverty affects students from many different groups, yet existing college policies, practices and structures rarely take it into account.
Even for students without children, financial aid rarely covers actual expenses. Federal financial need calculations often underestimate actual need, especially for students with lower socioeconomic status or more family responsibilities. Current federal financial aid meets the needs of only 35.7% of U.S. undergraduates. Accordingly, most U.S. students have to work to pay for college, taking away time that would likely be better spent studying.
Providing students with enough financial aid to enroll in college, but not enough to complete college, is counterproductive. Providing students with enough time – and thus money – for college is therefore not only a sound investment but also critical to honoring the values of fairness and opportunity for all.
Many college students don’t have enough time for their studies. This “time poverty,” as we call it, is often due to inadequate child care access or the need to work to pay for college and living expenses.
By 2060, less than 60% of non-Hispanic white population and about 65% of non-Hispanic multiracial population will be working age.
The nation as a whole is getting older, but not all race and Hispanic origin groups are aging at the same pace, a pattern that promises to alter the makeup of the U.S. working-age population for decades to come.
About two-thirds of the total U.S. population was working age (ages 15 to 64) in 2022 and about 17% were 65 and older.
But the non-Hispanic multiracial population, for example, had the smallest share (about 6%) of its population age 65 and older and the non-Hispanic White population the largest share (about 22%) in 2022, clear evidence that while the nation as a whole is becoming older, not all race and Hispanic origin groups are aging at the same rate.
In this article, we use population projections to examine how the age composition of the United States would change under various immigration scenarios for different race and Hispanic origin groups.
From 2010 to 2019, the U.S. working-age population grew by only 3.1% while the 65 and older population grew by 34%. Aging baby boomers, who will all be 65 or older by 2029, and declining fertility rates are expected to contribute to a continued rise in the median age of the U.S. population.
An increasing older population and a shrinking working-age population have implications for the health care system, informal caregiving, social security programs and the economy. But increases in fertility and immigration can help mitigate the impact because a greater share of immigrants are of working age than the native-born population, and fertility rates are higher among foreign-born women than native-born women.
Age structures and immigration levels, however, differ by race and Hispanic origin, so aging may affect some groups more than others.
Last November, the Census Bureau released the 2023 National Population Projections, which project the U.S. population to 2100 based on four immigration scenarios:
• The main series, considered the most likely immigration scenario, assumes that future international immigration trends will mirror the latest trends. • The high immigration scenario assumes a 50% increase in international immigration. • The low immigration scenario assumes a roughly 50% decrease in international immigration. • The zero immigration scenario assumes no international immigration and is considered a baseline for evaluating the overall contribution of immigration to population change.
The projections include demographic characteristics. Race and Hispanic origin are projected until 2060 but other characteristics like age, sex and nativity are projected to 2100.
Shrinking working-age populations projected in all race alone groups
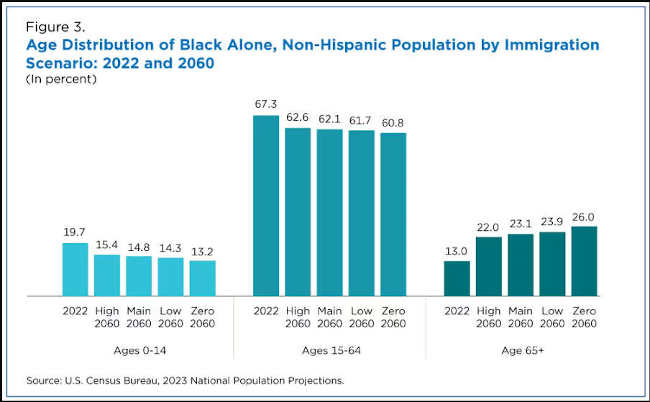
Figures 1 through 5 use the 2023 National Population Projections to show the age distribution of various race and Hispanic origin groups in 2022 and in 2060 under the four immigration scenarios.
These race and Hispanic origin groups include non-Hispanic Whites, non-Hispanic Blacks, non-Hispanic Asians, non-Hispanic Two or More Races (or multiracial) and Hispanics.
In 2022, the greatest share (70%) of the non-Hispanic Asian population was working age (Figure 1), followed by the Hispanic (Figure 2) and non-Hispanic Black populations, each with 67% (Figure 3); the non-Hispanic White population with 63% (Figure 4); and the non-Hispanic multiracial population with 57% (Figure 5).
In 2022, 22% of the non-Hispanic White population was age 65 or older, followed by the non-Hispanic Asian (14%), non-Hispanic Black (13%), Hispanic (8%) and non-Hispanic multiracial (6%) populations.
Most race and Hispanic origin groups are projected to experience a decline in the working-age share of their populations from 2022 to 2060. However, some groups are projected to experience a larger decline in the absence of high immigration.
According to the projections, future immigration flows will particularly impact the non-Hispanic Asian population’s age structure.
With high immigration, the non-Hispanic Asian working-age population would decline from almost 70% to about 65%, while the 65 and older group would increase from 14% to about 20%.
Under the low immigration scenario, the working-age population would decrease even more to 62%, and the share of older adults would go up to about 25%. Without any Asian immigration — a very unlikely scenario — the share of the working-age population for this group would drop to about 56% and the share of those 65 and older would rise to about 35%.
Other race and Hispanic origin groups are projected to follow similar patterns, but with smaller differences. The impact of immigration on the working-age and older Asian populations may be greater because such a large number of immigrants to the United States have been arriving from Asian countries, particularly China and India; Asians now outnumber Hispanics in terms of new immigrant arrivals.
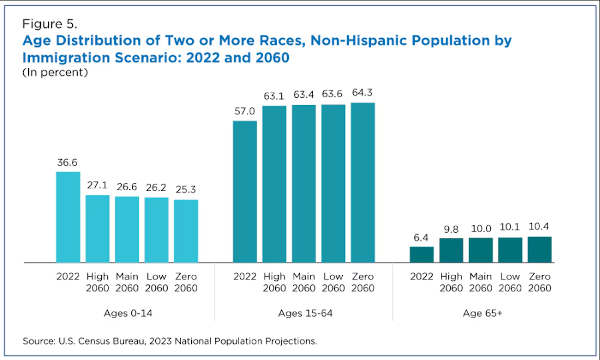
Non-Hispanic multiracial population only group projected to have working-age population increase
Unlike other race and Hispanic origin groups, the working-age share of the multiracial population is expected to increase in each immigration scenario from 57% in 2022 to about 63% in 2060 under both the main series and high immigration scenarios, and to about 64% under the low and zero immigration scenarios.
In 2020, the multiracial population was the youngest of all race groups with a median age of 29.5 (the most common age was 12). It is projected that by 2060, over 60% of this population will be working age.
The multiracial population consisted of a just 2.4% of the foreign-born population in 2018. As a result, future immigration trends will likely have a nominal effect on the working-age share of its population.
Because the non-Hispanic multiracial population was so young, its 65 and older population is expected to remain at around 10% in 2060 — the smallest percentage of all race and Hispanic origin groups.
Projected old-age dependency ratios by race and Hispanic origin
One way to assess the potential “economic burden” of an aging population on the working-age population is through old-age dependency ratios: the ratio of the population age 65 and older to the population ages 15-64.
Higher old-age dependency ratios indicate a greater number of people 65 and older who, in theory, need to be supported economically by the working-age population. Table 1 shows the old-age dependency ratios by race and Hispanic origin in 2022, as well as the projected dependency ratios in 2060 for the three alternative immigration scenarios.
In 2022, the non-Hispanic White population had the highest old-age dependency ratio at 34.9. That means that every 100 people who were of working-age supported about 35 people age 65 and older. The non-Hispanic Asian population had the next highest old-age dependency ratio at 20.3, followed by the non-Hispanic Black (19.3), Hispanic (12.3) and the non-Hispanic multiracial (11.2) populations.
Although the non-Hispanic White population had the largest old-age dependency ratio in 2022, all race and Hispanic origin groups are projected to experience an increase in 2060. But future immigration will affect some groups more than others.
For example, immigration is expected to have less of an impact on the non-Hispanic multiracial population than on other race and Hispanic origin groups. For the non-Hispanic multiracial population, the old-age dependency ratio is projected to increase at a much slower pace from 11.2 in 2022. By 2060, it is projected to increase to 15.6 under the high scenario; 15.8 in the main series; 15.9 in the low scenario; and 16.2 in the zero immigration scenario.
In other words, under each immigration scenario, every 100 non-Hispanic multiracial working-age people would support about 16 people age 65 and older by 2060.
The projected old-age dependency ratios for the non-Hispanic Asian population are most affected by expected immigration levels. For this group, old-age dependency ratios are projected to increase from 20.3 in 2022 to 31.2 under the high scenario; 35.4 in the main series; 39.9 in the low scenario; and 61.5 in the zero scenario.
For this group, high immigration would lessen the economic burden on the working-age population the most, while low and zero immigration would result in the greatest economic burden on the working-age population.
The old-age dependency ratios in 2060 are also projected to increase with less immigration for all other groups:
• Non-Hispanic White population – 50.4 in the high immigration scenario; 51.8 in the main series; 52.9 in the low immigration scenario; and 55.2 in the zero immigration scenario. • The non-Hispanic Black population is projected to have lower old-age dependency ratios than non-Hispanic White population – 35.2 in the high scenario; 37.2 in the main series; 38.8 with low immigration; and 42.7 with zero immigration. • The Hispanic population is projected to have lower old-age dependency ratios than all race groups except the non-Hispanic multiracial population – 27.2 in the high scenario; 28.9 in the main series; 30.2 in the low scenario; and 33.9 in the zero immigration scenario.
Chanell Washington and Line Nana Mba are statistician/demographers in the Census Bureau’s Population Evaluation, Analysis, and Projections Branch.
Written by: NATIONAL OCEANIC AND ATMOSPHERIC ADMINISTRATION
An annotated map of the world plotted with the most significant climate events of July 2024. See the story below as well as the report summary from NOAA NCEI at http://bit.ly/Global202407. Last month was Earth’s warmest July on record, extending the streak of record-high monthly global temperatures to 14 successive months.
The world’s sea-surface temperatures in July were the second-warmest on record, ending a run of 15 consecutive, record-setting months, according to data and scientists from NOAA’s National Centers for Environmental Information (NCEI).
Climate by the numbers
July 2024
The average July global surface temperature was 2.18 degrees F (1.21 degrees C) above the 20th-century average of 60.4 degrees F (15.8 degrees C), ranking as the warmest July in NOAA’s 175-year global record. July 2024 was also the 14th-consecutive month of record-high temperatures for the planet.
Last month’s temperatures were above average across much of the global land surface except for Alaska, southern South America, eastern Russia, Australia and western Antarctica. Africa, Asia and Europe had their warmest Julys on record, while North America saw its second-warmest July.
The global ocean temperature was the second warmest on record, ending a streak of 15 consecutive months of record-high temperatures. Sea-surface temperatures were above average over most areas, while parts of the tropical eastern Pacific and southeastern Pacific were below average.
Year to date
The year-to-date (YTD January–July) global surface temperature was 2.30 degrees F (1.28 degrees C) above the 20th-century average, making it the warmest YTD on record. Africia, Europe and South America each experienced their warmest YTD temperatures.
According to NCEI’s Global Annual Temperature Rankings Outlook, there is a 77% chance that 2024 will rank as the warmest year on record and nearly a 100% chance it will rank in the top five.
Other notable climate events
Global sea-ice coverage was below average: July had the second smallest sea ice coverage in the 46-year record at 8.49 million square miles, which was 1.09 million square miles below the 1991–2020 average. Arctic sea ice coverage was below average (by 330,000 square miles), and Antarctic sea ice extent was below average (by 760,000 square miles).
July tropical activity was below average: Seven named storms developed across the globe in July, which was below the 1991–2020 average. The Atlantic basin had two, including Hurricane Beryl, the earliest Category 5 hurricane on record; the East Pacific had three and the West Pacific, two.
 How to resolve AdBlock issue?