 How to resolve AdBlock issue?
News
- Details
- Written by: LAKE COUNTY NEWS REPORTS
“In the midst of a COVID-19 pandemic, a severe flu season could be devastating for California,” said Dr. Tomás J. Aragón, director of the California Department of Public Health and State Public Health Officer. “Getting a flu shot is a safe and simple thing we can all do to keep people out of the hospital and reduce the strain on our health care system.”
In California, flu season is October through May and flu activity usually begins to increase in late November or December. It takes a couple of weeks after vaccination for the body to build immunity.
Getting vaccinated now before the flu season ramps up is the best time to protect yourself, your family and your community, officials said.
CDPH recommends the annual flu vaccination for everyone six months of age and older. Getting vaccinated against the flu is particularly important for people at high-risk of severe disease and hospitalization, including:
— People 65 years and older.
— People who smoke or have underlying medical conditions like diabetes, heart disease, asthma, lung disease, neurologic disorders and weakened immune systems.
— Pregnant women and children under five years of age.
— Caregivers and residents in long-term care facilities.
— Essential workers who encounter others outside their homes or at higher risk because of their occupation.
CDPH encourages Californians to contact their health care provider, physician's office, or clinic about getting the flu vaccine. Adults may also get immunized at the pharmacy where they generally pick up their prescriptions. Pharmacies accept most insurance, including Medi-Cal.
Some local health departments may offer low- or no-cost flu immunizations. If you still haven’t had the COVID-19 vaccine or are due for a booster, the flu vaccine and COVID-19 vaccine can be given on the same day.
Besides getting immunized, you can also take everyday preventive actions to stop the spread of germs:
— Continue to wear a mask.
— Stay away from people who are sick and stay home when you or other family members are sick for at least 24 hours after symptoms go away before you are around others.
— Cough or sneeze into your elbow, arm, or disposable tissue. If you use disposable tissue, use hand sanitizer, or wash your hands afterwards.
— Wash hands frequently and thoroughly with soap and warm water or use an alcohol-based hand sanitizer.
— Avoid touching your eyes, nose, and mouth.
For more information about the flu, visit CDPH's website.
- Details
- Written by: Angela De Palma-Dow
How do I get information about the water level of the lake? Is the lake at the lowest that it has ever been? How low will the lake get this year and what is predicted for rain this winter?
Thanks!
From “Learning about Lake Levels!” Lorne
Dear Lorne,
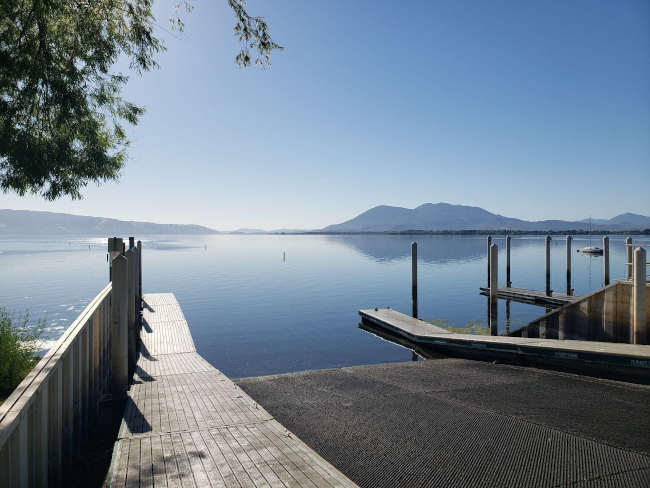
This is a great set of questions Lorne! Also, you are not the only one who has asked about lake levels. Clear Lake’s water level is very low right now, exposing large areas of shoreline and sediment, some that have not been this dry and exposed for decades!
During the drought this year, the low lake level is a concern for many who live on the lake and see the declining edge of the water. Regardless if you are a fisherperson, a shoreline property owner or renter, or enjoy recreation like wake surfing or kayaking, less water in the lake is of extreme interest to many. Being aware of the lake level is fairly easy to do.
Measuring lake levels
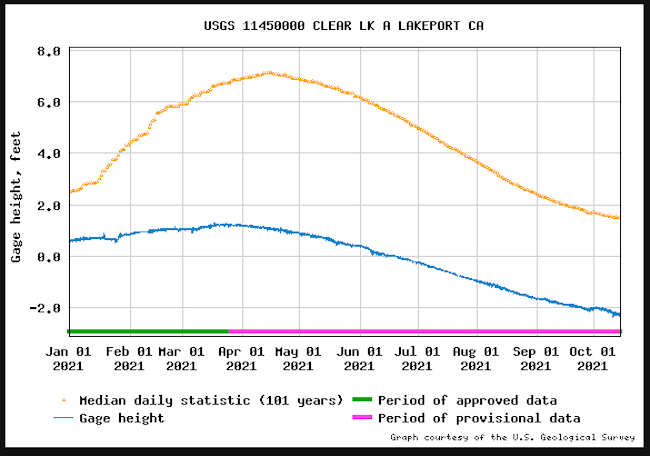
Daily lake level data is measured from an in-lake gauge (#11450000) operated and maintained by the United States Geological Survey (USGS).
The gauge has historically been located on a pier at Lake County Vector Control District in Lakeport, but due to the recent drought conditions and lack of water depth at the gauge’s normal location, the gauge was temporarily moved to the Fifth Street ramp at Library Park in Lakeport.
The move caused a few swings of up and down lake level readings during the week around Oct. 7, but as of Oct. 15, the measurements have stabilized. However, the USGS maintains that all online data is provisional until verified and confirmed and usually that can take several months.
Note: The vernacular use of “gage” and “gauge” can be used interchangeably and both can be used as a verb or a noun. The USGS has a historical affinity for the use of “gauge” and according to Merriam-Webster Dictionary, considering global use, “gauge” is the preferred variant of this word and is used more commonly then “gage.” If you ask the Lady of the Lake, life is too short to gage your success by the amount and type of gauges being counted, but don’t mind me and pick the gauge/gage that is right for you!
Gauge relocation and replacement is not a new thing, in fact it has happened many times over the history of USGS monitoring Clear Lake water levels.
For example, prior to 1984, the gauge was located on the public pier on third street in Lakeport, then moved to a private pier a few blocks south. The gauge at that time was non-recording, meaning it didn’t log data, someone had to go out and write down the measurement in a log book. Now the gage measures, stores, and transmits data to USGS satellite and the data quickly makes its way to the gage website.
Then in 1984, the gage was moved to its current permanent home at Lake County Vector Control District on Esplanade in Lakeport. Throughout the years the gage has been adjusted, replaced, repaired and upgraded, and some years during extreme droughts or floods it’s temporarily relocated for better access or to ensure more accurate measurements.
It makes sense that Vector Control would be good partners for a lake gage as low and high water levels influence habitat availability for mosquitos. Also, believe it or not, before the internet, folks would call into the Vector Control District and ask for the current lake levels; now they are simply a few clicks away on your computer or smartphone!
The lake level data is available online in graph or tabulated format at the USGS Clearlake Lakeport CA station.
If you wanted to know stage height data from other gauges around the state, I suggest you explore the Sierra Nevada River Forecast Network Interactive Map. On this site, you can find different lakes or rivers with real-time gages measuring lake levels, stream height and stream flow.
Also, the Lake County Water Resources Department monitors the daily lake level and can provide that to you by phone 707-263-2344, if you do not have access to the website.
How lake level is determined
Clear Lake is different then every other lake, reservoir or water body out there when it comes to the lake level measurement method.
Clear Lake uses the “Rumsey Gage” unit of measurement. This measurement was established by Captain Rumsey in 1873. The measurement was derived from the natural levels of the lake as determined by the Grisby Riffle, with a range between zero and 7.56 feet Rumsey, which is the natural low and high levels of the lake.
For example, the low level at “zero rumsey” is the point at which water is too low to pass the Riffle and flow down Cache Creek; it’s the “natural low” level of the lake.
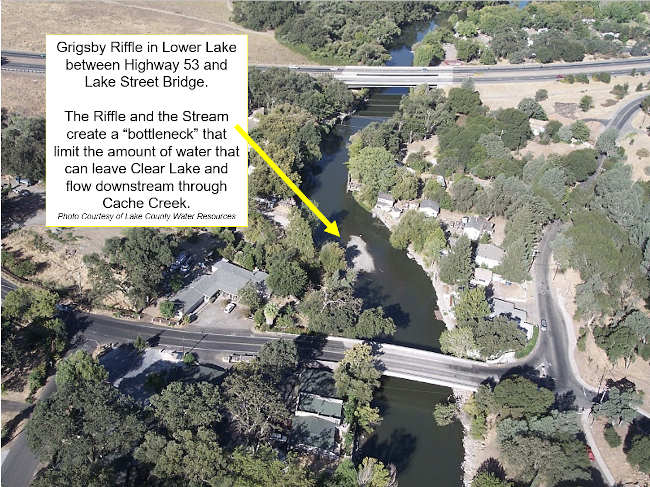
Unlike reservoirs, Clear Lake’s water level is naturally controlled by the Grigsby Riffle. The Grigsby Riffle is a naturally formed rock gravel formation at the confluence of Cache Creek and Seigler Creek; this spot can be easily observed from the Lake Street Bridge in Lower Lake.
The combination of elevation, gravel accumulation and creek bed constriction physically limits the maximum amount of water that can pass through from the lakeside downstream to the rest of Cache Creek.
There is a court-ordered “Bemmerly Decree” (1940) that prohibits the excavation or alteration of the Riffle, meaning that no one is allowed to build up or tear down the riffle which maintains the water level in Clear Lake from leaving “too fast” down Cache Creek.
You may notice this phenomenon during flood years, where even though the Cache Creek dam (located 3 miles downstream Cache Creek) is fully open, the amount of water flowing through is the same. The gravel impoundment, stream shape and stream bottom elevation of the Grisby Riffle is literally controlling the amount of water that can leave and flow out of the lake. This is the bottleneck point.
Many think the Cache Creek dam, managed by Yolo County, is open all the time and allowing “all the water to flow from the lake”; but in fact most of this current drought year Cache Creek above and around the Grisby Riffle has been dry — for months water has not been flowing out of Clear Lake down through Cache Creek.
There is a base flow of water that does flow downstream from Cache Creek to Yolo County, but the amounts of Clear Lake water allowed to be actively “taken” from the lake to Yolo are regulated naturally and legally.
The other court-ordered decrees, the Gopcevic (1920) and the Solano (1978, revised in 1995), limit the amount and timing of water to be released by the Cache Creek Dam. This year, Yolo County was not able to use any of the water in Clear Lake as the lake level was too low to “share” as declared by these decrees. This is important to note because the water level we see today in Clear Lake would be the same regardless if there was a regulated dam downstream or not.
The history of the Decrees and story about how Yolo County gained water rights of Clear Lake is fascinating (albeit a bit frustrating) and I recommend anyone interested to grab a cup of tea, a quiet window seat, and dedicate some time to read the information provided online by the County of Lake Water Resources including “The History of Clear Lake” and “How Yolo Obtained Water Rights.”
What about next year's rain outlook and impacts on lake level?
As for the lake levels next year, we still don’t know how much rain we will get this next wet season or if that rain will be sufficient to saturate the ground within the watershed and accumulate into enough runoff to replenish Clear Lake.
Some climate predictions by NOAA’s National Weather Service and the International Research Institute for Climate and Society have indicated that we are going into La Niña oscillation with high probability (87%).
La Niña winters are known for cooler than normal ocean conditions, which usually mean southern areas of the country tend to stay drier and warmer than normal and northern parts of the country are cooler and wetter than average. Northern California is located somewhere in the middle of these patterns, but it’s a good guess that this year’s La Niña might prolong drought conditions one more year.
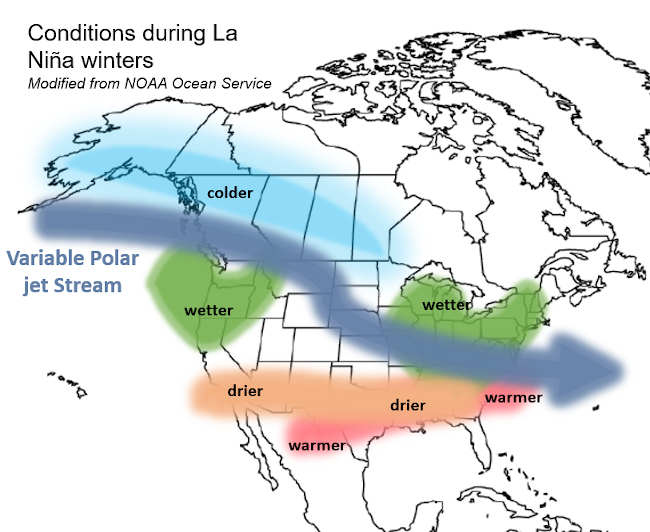
While not directly related to lakes, the Lady of The Lake loves to learn about ocean patterns and impacts on inland waters. NOAA’s National Ocean Service makes connections between La Niña / El Niño climate patterns that have direct impacts on natural occurrences and disasters on the mainland, like floods and wildfires.
While probability is high that La Niña will characterize the type of winter and wet season that will occur across the Pacific states this coming winter, the most accurate predictions will come to fruition in November. And until then, we shall remain hopeful and gauge that daily lake level gage data.
Sincerely,
Lady of the Lake
The Lady of the Lake would like to acknowledge and thank Dr. Jamie Scott at Lake County Vector Control District and D. McGee at USGS for their help in contributing valuable information to this article.
Angela De Palma-Dow is a limnologist (limnology = study of fresh inland waters) who lives and works in Lake County. Born in Northern California, she has a Master of Science from Michigan State University. She is a Certified Lake Manager from the North American Lake Management Society, or NALMS, and she is the current president/chair of the California chapter of the Society for Freshwater Science. She can be reached at
- Details
- Written by: LAKE COUNTY NEWS REPORTS
The committee is pursuing a $3 million grant from the state’s Proposition 68 Regional Parks Program.
As part of that process, the committee held four community planning meetings, resulting in three proposed plans for the horse park they plan to build on Highway 175, just west of Lakeport.
Descriptions of the plans and pictures of each are published below.
Click on this link to participate in the survey and give input on the preferred plan.
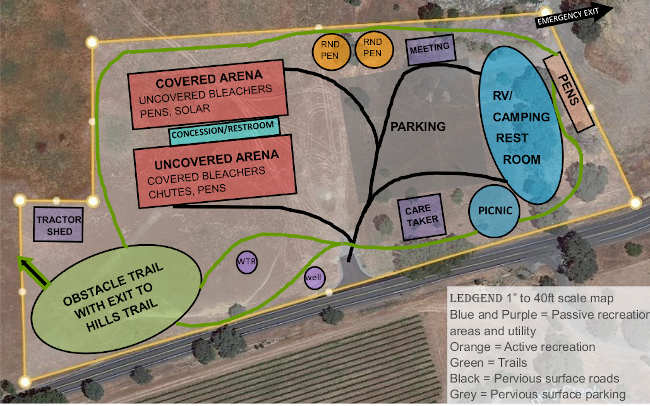
Horse Park — Map A
Map A includes two arenas, one covered, one uncovered.
The covered arena, 130 by 200 feet, with a tilled dirt floor, open bleachers on the west end, and horse pens on the north side, is designed to be used by riders and drivers year-round. The roof would have solar to offset utility expenses.
An uncovered arena, 130 by 200 feet, with a tilled dirt floor, can accommodate riders, drivers, and a junior rodeo with three bucking chutes and stock pens, an announcer’s booth overhead, roping chutes, and fencing to move animals.
Bleachers would be on the south side of each arena, with restrooms and a concession stand in between.
There are two round pens and a large obstacle course for horse and horsemanship training. A meeting room for educational and social activities is located adjacent to the parking area.
Overnight camping is under the trees along with covered picnic tables and barbecues. The caretaker home is nearby and handy to the entrance.
There is a perimeter riding/driving/hiking trail, and a gate on the west boundary that leads to a 4-plus mile loop trail in the nearby hills.
The tractor shed is convenient to both arenas and the obstacle area. The well is at the bottom of the hill and the water tank is at the highest point on the property.
There is an emergency exit on the northeast edge of the property (if permitted) to provide a second access to Highway 175.
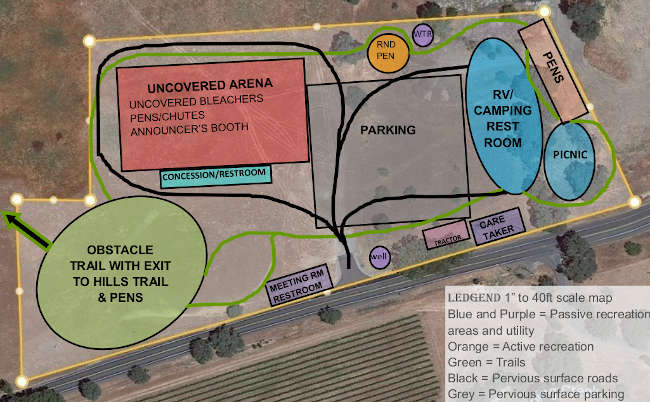
Horse Park — Map B
Map B includes an uncovered arena, 150 by 328 feet, that can be used by riders and drivers and can offer a PRCA rodeo.
It has stock pens on the west end, bucking and roping chutes on the north side, and fencing to move animals. Uncovered bleachers run along the south side, with restrooms and concession stands behind or under them.
A road circles the arena to deliver rough stock for rodeo events and accommodate emergency vehicles.
There is an obstacle course and a round pen for horse and horsemanship training, and a meeting room (with restroom) for educational and social activities.
Overnight camping under the trees includes restrooms with showers, and a picnic ground with covered tables and barbecues. The camping area would be used exclusively for competitor parking during rodeo events.
There is a perimeter riding/driving/hiking trail, and a gate to the west that leads to a 4-plus mile loop trail in the nearby hills.
The caretaker house, tractor shed, and well are located between the entrance and the camping area.
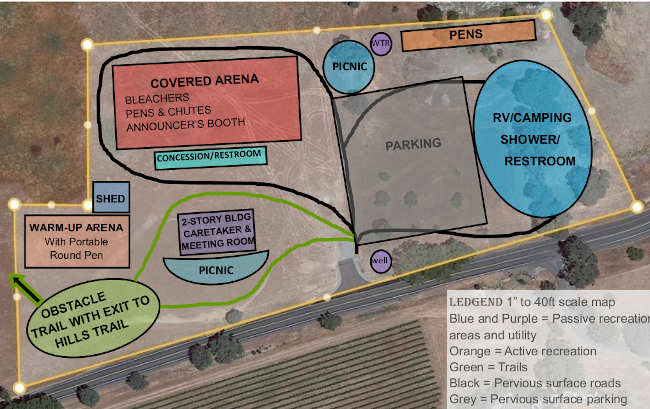
Horse Park — Map C
Map C includes a 150 by 328 foot Covered Arena, with tilled earth footing, designed for riding, driving, and PRCA rodeos.
It has covered bleachers on both the north and south sides, an announcer’s booth above the six bucking chutes and six stock pens on the west side, roping chutes on the east side, and fencing along the south side for moving stock to the east chutes.
A road circles the arena to deliver rough stock for rodeo events and accommodate emergency vehicles.
There is a 30-foot by 45-foot warmup arena with a portable round pen, and an obstacle course for horse and horsemanship training. The tractor shed is located nearby for convenience.
One level of a two-story building provides a two bedroom, two bath caretaker home, the other level provides a meeting room for educational and social activities.
Separate covered (circle) and uncovered (moon) picnic grounds have tables and barbecues. Overnight camping is located under mature trees, with restrooms and showers. The camping area would be used exclusively for competitor parking during rodeo events.
There is a perimeter riding/driving/hiking trail, and a gate on the west boundary that leads to a 4-plus mile loop trail in the hills to the west.
The well is located at the lowest point on the property and the water tank is located higher, at the north edge of the property.
- Details
- Written by: Susan Kocher, University of California, Division of Agriculture and Natural Resources and Ryan E. Tompkins, University of California, Division of Agriculture and Natural Resources
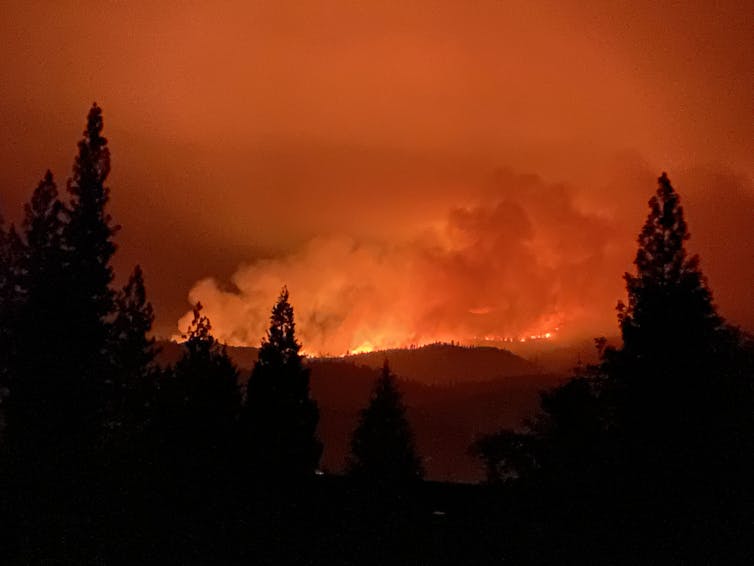
Californians have been concerned about wildfires for a long time, but the past two years have left many of them fearful and questioning whether any solutions to the fire crisis truly exist.
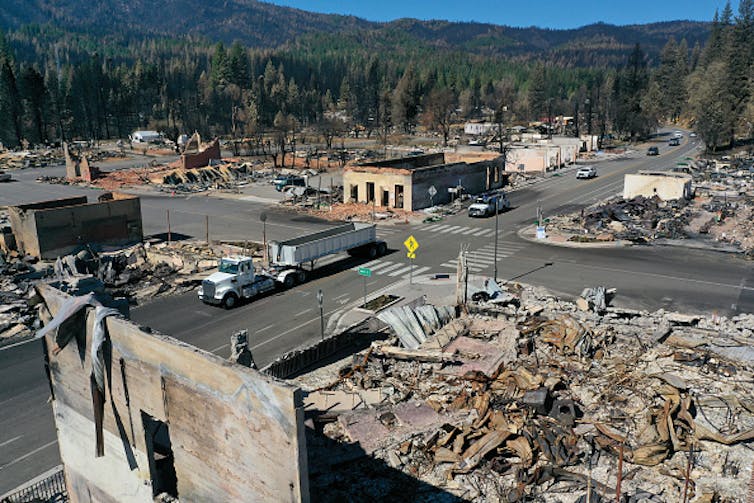
The Dixie Fire in the Sierra Nevada burned nearly 1 million acres in 2021, including almost the entire community of Greenville. Then strong winds near Lake Tahoe sent the Caldor Fire racing through the community of Grizzly Flats and to the edges of urban neighborhoods, forcing the evacuation of tens of thousands of people – including one of us. Those were only the biggest of the 2021 fires, and the risk isn’t over. A wind-blown fire that started Oct. 11 was spreading quickly near Santa Barbara on the Southern California coast.
As foresters who have been working on wildfire and forest restoration issues in the Sierra Nevada for over a quarter of a century, we have found it painful to watch communities destroyed and forests continuing to burn to a crisp.
The main lesson we gather from how these fires have burned is that forest fuels reduction projects are our best tools for mitigating wildfire impacts under a changing climate, and not nearly enough of them are being done.
Two historic policies, in our view, led the western U.S. to the point where its forests have become so overgrown they’re fueling megafires that burn down whole communities.
Fire suppression
The first policy problem is fire suppression and exclusion.
Fire is an essential ecological process, and many of the ecosystems in the West are adapted to frequent fire, meaning plant and wildlife species have evolved to survive or even thrive after wildfires. But most people arriving in California during colonization, both before and after the Gold Rush of 1849, fundamentally misunderstood the nature of frequent fire forests.
As state and federal agencies evolved policies on forest management, they considered all fire to be an existential problem and declared war. The U.S. Forest Service kicked off a century of fire suppression in the West after the devastating fires of 1910, known as the “Big Blowup” or “Big Burn,” by implementing the 10 a.m. policy. It aimed for full suppression of all fires by 10 a.m. the day after they broke out.
Native people who practiced prescribed fire to manage forests were removed from their homelands, and burning was criminalized. California made prescribed fire illegal in 1924, and it remained illegal for decades until a better appreciation of its importance emerged in the 1970s.
Past harvesting practices lead to regulations
The second policy issue is the regulatory approach that grew out of past logging practices.
Foresters and early California communities were interested in forests for lumber and fuel wood. They sent the largest – and most fire-tolerant – trees to mills to be turned into lumber, which was used to build California’s cities and towns.
Poorly executed logging in some areas led to concerns from residents that forest cover and habitat was shrinking. As a result, state and federal regulations were developed in the 1970s that require managers proposing forest projects to consider a “no action alternative.” In other words, maintaining dense forest habitat in the long term was considered a viable management choice.
On private land, few owners today thin the forest to levels that would mimic the more fire-resilient forests found in the Sierra at colonization. The California Forest Practices Act until recently required replanting after timber harvest to levels much more dense than were found at colonization. In other words, our current regulatory framework promotes maintaining high levels of forest density, when much more drastic removal of vegetation is needed.
Taken together, these policies have promoted 21st-century forests that are younger, denser and more homogenous – making them vulnerable to increasingly severe disturbances such as drought, insect outbreaks and fire. This new reality is exacerbated by a changing climate, which turns the regulatory assumption that active and widespread forest management is riskier than no management on its head.
Agency priorities change as the crisis grows
Just as forests have changed, so too have the agencies that manage and regulate them. The U.S. Forest Service has seen its budgets for fighting fires balloon while its capacity to proactively manage forests has been shrinking. The California Department of Forestry and Fire Protection, known as CAL FIRE, has also seen large increases in firefighting budgets, though the state legislature has recently moved to increase fire prevention funds, too.
Living in communities threatened by wildfires this summer, we are very grateful to firefighters who have saved our homes. Yet we also are concerned that more large, high-severity wildfires burning across the landscape mean less funding and staff will be available for proactive fuels reduction projects like forest thinning and prescribed fires.
How do we get out of this mess?
The Dixie and Caldor fires that destroyed Greenville and Grizzly Flats provided evidence that forest fuels reduction projects can work.
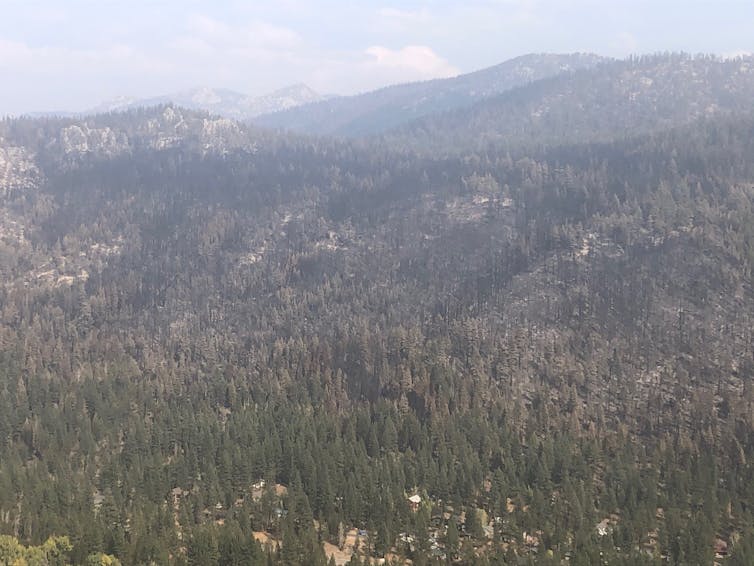
Both fires burned less severely in areas with proactive forest restoration and fuels management projects, including near South Lake Tahoe and near Quincy.
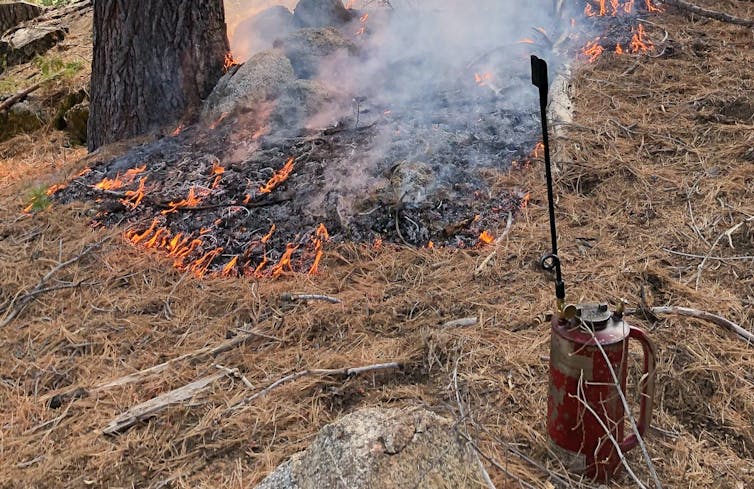
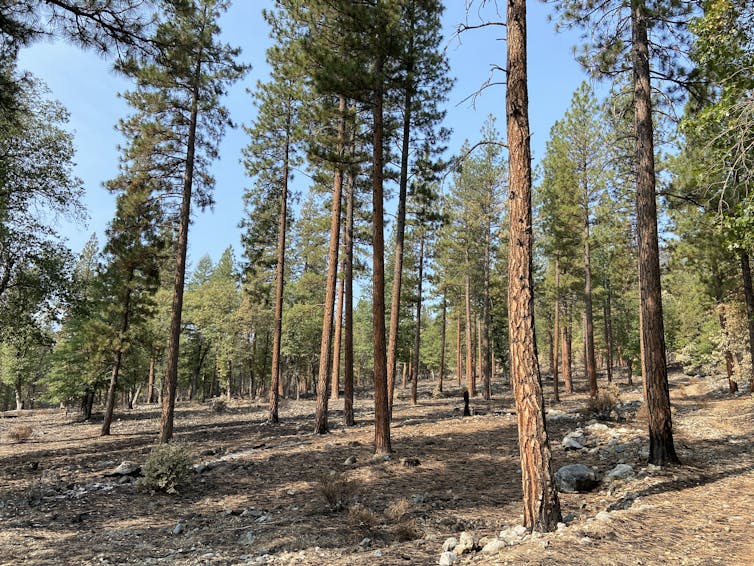
Fuels reduction projects include thinning out trees, burning off woody debris and reducing “ladder fuels” like small trees and brush that can allow fire to reach the tree canopy. They create more open forests that are less likely to fuel severe megafires. They also create strategic areas where firefighters can more easily fight future blazes. And, because fires burn less intensely in thinned forests, they leave more intact forest after a fire for regenerating new trees and sequestering carbon. Prescribed fires and managed ignitions paid huge dividends for containing the Dixie and Caldor fires.
To manage fires in an era of climate change, where drier, hotter weather creates ideal conditions for burning, experts estimate that the area treated for fuels reduction needs to increase by at least an order of magnitude. We believe government needs to accomplish these four things to succeed:
1) Drastically increase funding and staff for agencies’ fuels reduction projects, as well as outreach, cost-sharing and technical assistance for private forestland owners. Although the Biden administration’s proposal for a Civilian Climate Corps proposes funding to bring in more young and unskilled workers, funding more federal and state agency positions would recruit more natural resource professionals, provide career-track opportunities and better add forest restoration capacity for the long term.
2) Reduce regulations on forest and fuels management efforts for both public and private land. While California and the federal government have made recent strides to streamline regulations, land management agencies need to acknowledge the biggest risk in frequent fire forests is doing nothing, and time is running out. Agencies need to drastically cut the time needed to plan and implement fuels reduction projects.
3) Invest in communities’ capacity to carry out local forest restoration work by providing long-term support to local organizations that provide outreach, technical assistance and project coordination services. Funding restoration through competitive grants makes development of long-term community capacity challenging at best.
4) Provide funds and financial incentives for at risk communities to retrofit homes to withstand wildfires and reduce fuels around homes, communities and infrastructure.
Under a changing climate, we will have to learn to coexist with wildfires in the U.S. West, but this will require concerted action and a cultural shift in how we view and manage our forests and communities to be resilient.
[Like what you’ve read? Want more? Sign up for The Conversation’s daily newsletter.]![]()
Susan Kocher, Cooperative Extension Forester and Natural Resources Advisor, University of California, Division of Agriculture and Natural Resources and Ryan E. Tompkins, Cooperative Extension Forester and Natural Resources Advisor, University of California, Division of Agriculture and Natural Resources
This article is republished from The Conversation under a Creative Commons license. Read the original article.